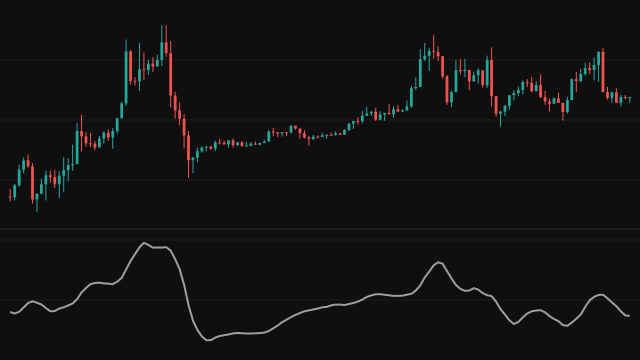
The Absolute Price Oscillator measures momentum as the distance between two exponential moving averages of the source, a fast one and a slow one, expressed in the instrument's own price units. When the fast average is above the slow one the reading is positive, and when it is below the reading is negative.
Both averages start from the first value of the source, so the line begins on the first bar at zero. Because an average started this way leans towards its starting value, the study divides both averages by 1 - e, where e is (1 minus the slow weight) raised to the number of bars after the first. As the slow average fills, e shrinks towards zero and the divisor approaches 1. Once e falls below 1e-10 the correction stops and the plain difference is plotted.
How to read Absolute Price Oscillator (APO)
Above zero, the short-term average is running ahead of the long-term one and momentum is upward; below zero it is downward. A cross of the zero line is the point where the two averages cross. The slope of the line shows whether that momentum is building or fading.
Because the values are in price units, readings are not comparable between instruments at very different prices, and the same move reads larger on a higher-priced market. For a comparison across instruments, a percentage version of the same gap is the better tool.
Settings
- Source
- The price series both averages are computed from, the close by default.
- Fast Length
- Length of the fast exponential average. Shorter values make the oscillator react sooner to price changes.
- Slow Length
- Length of the slow exponential average, which also sets how long the early bias correction lasts.
Frequently asked questions
How is it different from MACD?
The main line is the same idea, a fast minus a slow exponential average. This study plots only that line, with no signal line or histogram, and corrects the early bars for the starting bias.
Why does the line start at zero?
Both averages begin at the first value of the source, so on the first bar they are equal and their gap is zero.
Can I compare readings across instruments?
Not directly. The output is in price units, so a 100-point gap means something different on an instrument priced at 1,000 than on one priced at 60,000.