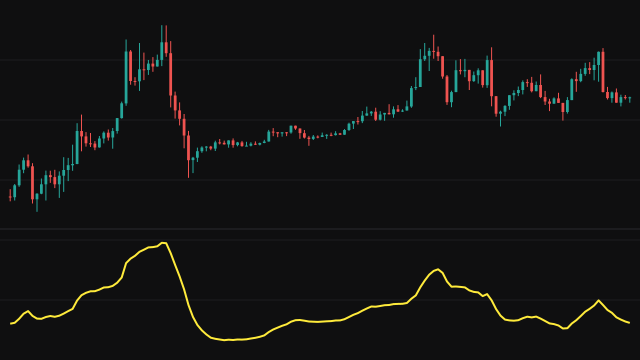
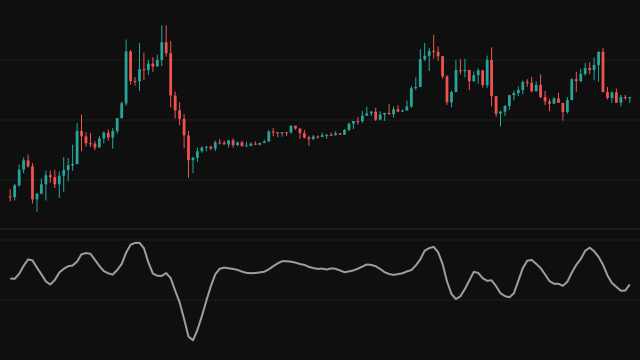
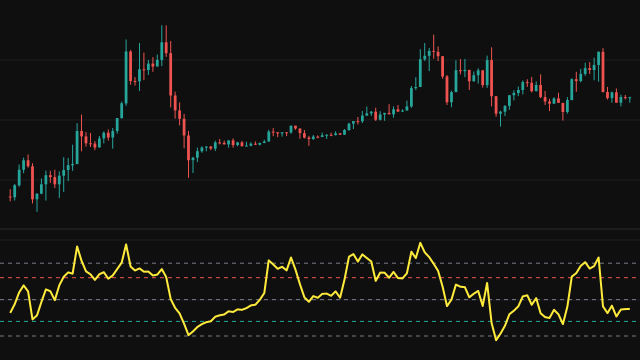
The Awesome Oscillator compares short-term and longer-term momentum using the midpoint of each bar, high plus low over two. It takes a fast simple average and a slow simple average of that midpoint and plots the fast one minus the slow one.
Both averages cover the bars seen so far until their windows fill, so the line starts on the first bar instead of after a warmup gap. The slow window is always kept at least one bar longer than the fast one. The line is green on bars where it is at or above its previous value and red where it is lower, and red on the first bar, which has no previous value.
How to read Awesome Oscillator (AO)
Above zero, the recent midpoints are higher than the longer average and momentum is upward; below zero it is downward. A cross of the zero line marks the point where the two averages cross. The colour shows whether the reading is rising or falling from one bar to the next, so a run of green below zero means downward momentum is easing.
The values are in price units, so they scale with the instrument's price. The first bars are averages of fewer than a full window and are less reliable than the rest of the line.
Settings
- Fast Length
- Number of bars in the fast average of the midpoint. Shorter values react sooner.
- Slow Length
- Number of bars in the slow average of the midpoint. It is raised to one bar more than the fast length if set lower.
Frequently asked questions
Why does it use the midpoint instead of the close?
The midpoint, high plus low over two, reflects where the whole bar traded rather than one closing moment, which makes the averages a little less sensitive to the close alone.
What do the colours mean?
Green means the oscillator is at or above its value on the previous bar, red means it is lower. The colour describes the change, not whether the value is above or below zero.
What if the fast length is not shorter than the slow one?
The study keeps the slow window one bar longer than the fast one, so the two averages always differ in length.