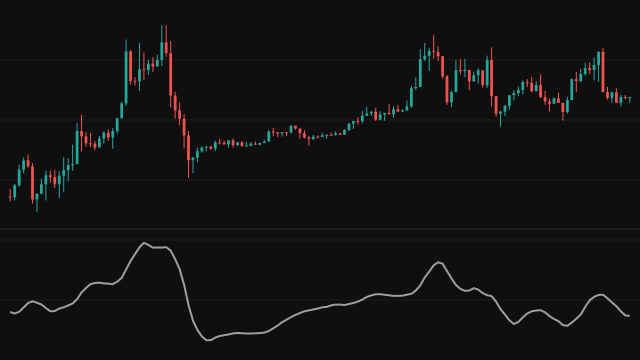
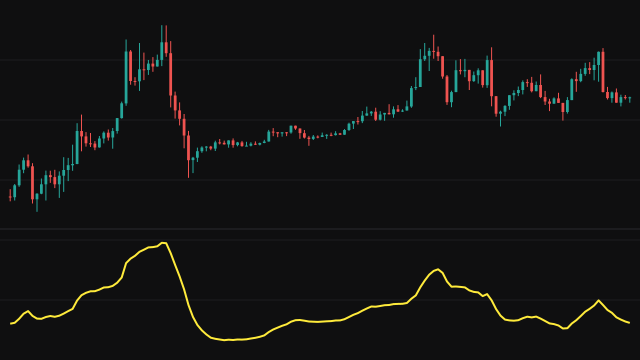
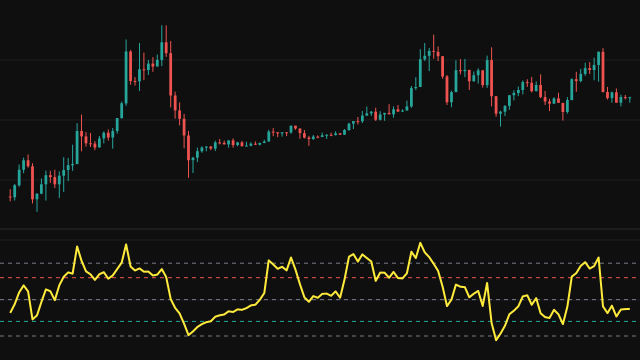
The Accelerator Oscillator looks one step beyond momentum. It first builds a momentum line from the midpoint of each bar, high plus low over two: a fast simple average of the midpoint minus a slow one. It then subtracts a five-bar simple average of that momentum line from the line itself.
What is left is the change in momentum, so the oscillator tends to turn before the momentum line does. Every average here covers the bars seen so far until its window fills, so the study draws from the first bar. The slow window is always kept at least one bar longer than the fast one. The line is green when it is at or above zero and red when it is below.
How to read Accelerator Oscillator (AC)
Above zero, momentum is running ahead of its recent average, which means it is accelerating; below zero it is decelerating. A move from red to green says the driving force behind the trend has started to pick up, often before price or the momentum line turns.
The oscillator is sensitive and changes sign often, so a single bar of one colour says little; a run of bars in the same colour is a firmer reading. The values are in price units, and the first bars average fewer than a full window, so they are less reliable than the rest.
Settings
- Fast Length
- Number of bars in the fast average of the midpoint. Shorter values make the oscillator react sooner.
- Slow Length
- Number of bars in the slow average of the midpoint. It is raised to one bar more than the fast length if set lower.
Frequently asked questions
How is it different from the momentum line it is built on?
The momentum line is a fast minus a slow average of the midpoint. This oscillator subtracts a five-bar average of that line, so it shows how fast momentum is changing rather than its level.
Can I change the five-bar smoothing?
No. The smoothing window is fixed at five bars; only the fast and slow lengths of the underlying momentum line are settings.
What do the colours mean?
Green is a reading at or above zero, red is a reading below zero.