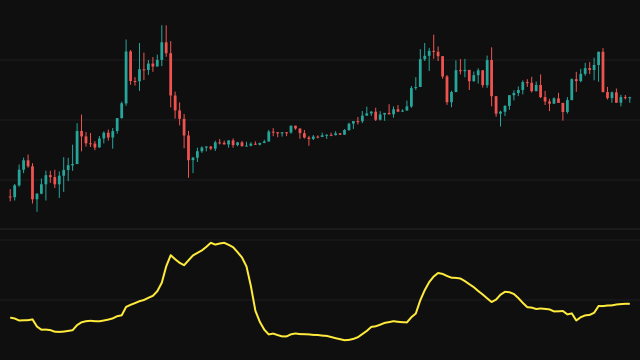
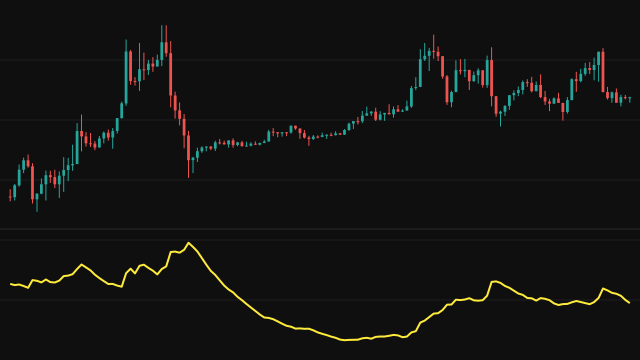
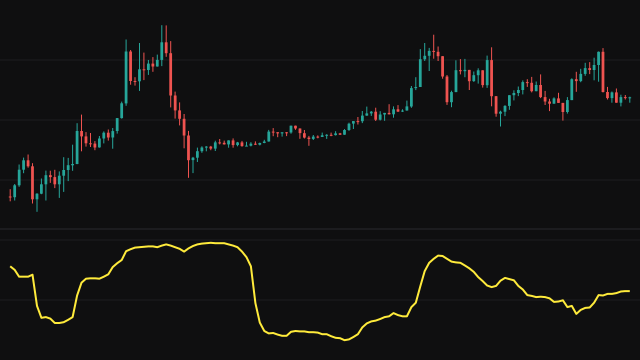
Bollinger Band Width measures the gap between the upper and lower bands of a standard deviation channel. Over the last period bars the study keeps a running sum of the source and of its square, and from those computes the mean and the population standard deviation, sqrt(E[x^2] - E[x]^2). A missing source value counts as zero.
The band sits multiplier deviations above and below the mean, so the width between them is 2 * multiplier * deviation. While fewer than period bars exist the window covers every bar so far. The first bar, with a single value, has no width and is left empty.
How to read Bollinger Band Width (BBW)
A low and falling width means prices have been packed tightly together, the condition often called a squeeze, which traders watch because a larger move can follow. A high and rising width means prices are spreading out, usually during a strong trend or a sharp reversal. The width says nothing about which way the next move will go.
The width is in price units, so its level depends on the price of the instrument. Compare it with its own history on the same chart rather than with another instrument, or use the normalized or percentile versions for a fixed scale.
Settings
- Period
- How many bars the mean and deviation are measured over. A longer period gives a smoother, slower width.
- Source
- The price series the bands are built around, the close by default.
- StdDev Multiplier
- How many deviations each band sits from the mean. The width scales directly with it.
Frequently asked questions
Is this the same as the band width divided by the mean?
No. This study reports the raw distance between the bands in price units. It is not divided by the middle line.
Why is the first bar empty?
A deviation needs more than one value. With a single bar the width would be zero, which is not a measurement, so the study leaves it blank.
What deviation does it use?
The population deviation, which divides by the number of values in the window rather than one fewer.