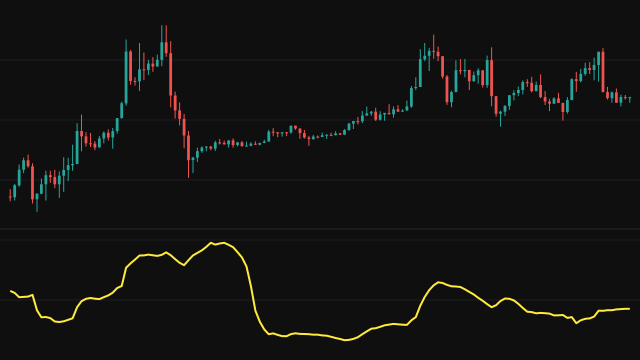
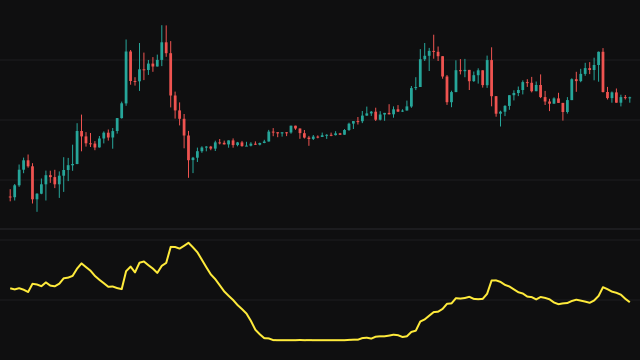
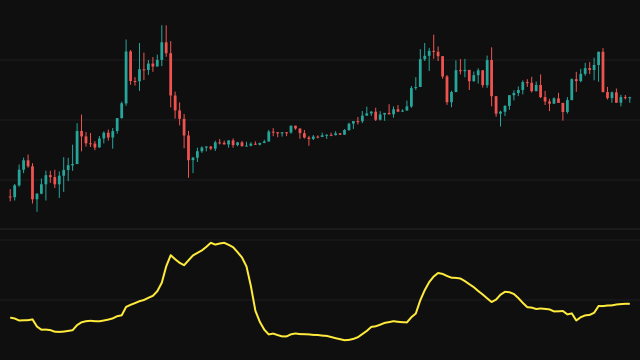
Average True Range Percent expresses the average true range as a share of the current price. Each bar's true range is the largest of high minus low and the distances from the high and the low to the previous close, so gaps count as movement. On the first bar there is no previous close and the true range is just high minus low.
The true range is smoothed with a running average of weight 1 / length, started from zero and divided by 1 - e on each bar, where e is the weight the zero start still holds, so the average is usable from the first bar. The result is divided by this bar's close and multiplied by 100. A bar with a zero close has no reading.
How to read Average True Range Percent (ATRP)
Read ATRP as the typical size of one bar as a percentage of price. A reading of 1.5 means a typical bar moves about one and a half percent. Because it is relative to price, it lets you compare how lively two instruments are, or how volatile one instrument is now against years ago when it traded at a very different level.
Rising values mean wider bars relative to price; falling values mean a calmer market. Like ATR it carries no direction, and a falling price on its own raises the reading slightly even when the bars stay the same size.
Settings
- Length
- How many bars the average of the true range effectively covers. Shorter reacts faster, longer is smoother.
Frequently asked questions
How is this different from ATR?
It is the same average true range divided by the close and multiplied by 100. ATR is in price units; ATRP is a percentage, so it compares across instruments and price levels.
Why can ATRP rise when the bars do not get bigger?
The close is the divisor. If price falls while the size of the bars stays the same, each bar becomes a larger share of the price and the reading rises.
Does it have a value from the first bar?
Yes. The running average is corrected for its zero start, so it answers from the first bar rather than waiting for a full window.