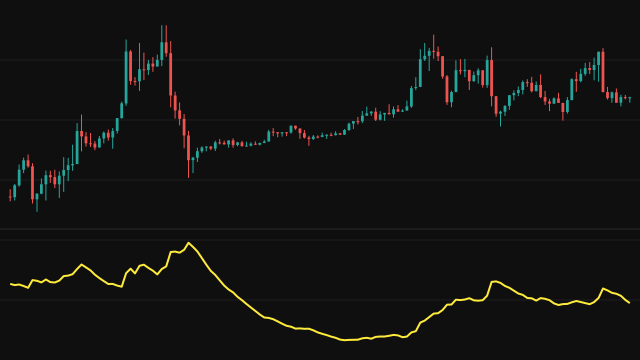
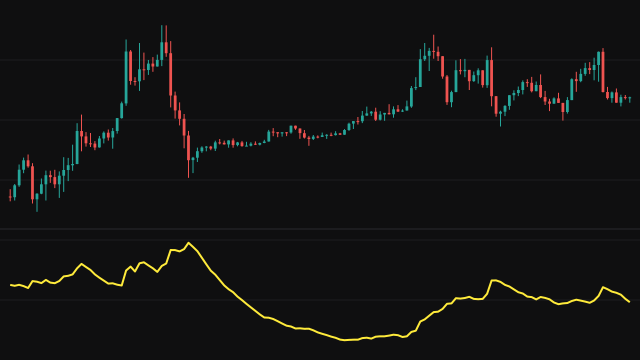
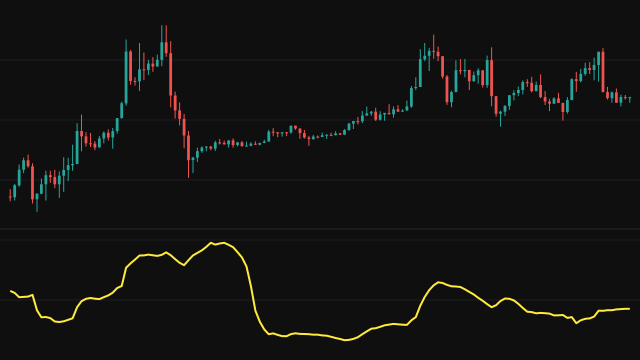
Average True Range Normalized answers one question: is volatility high or low compared with its own recent history? It first computes the average true range. Each bar's true range is the largest of high minus low and the distances from the high and the low to the previous close, and on the first bar it is high minus low. That is smoothed with a running average of weight 1 / length, started from zero and divided by 1 - e so it is usable from the first bar.
The study then looks back over the last 10 * length bars, or every bar so far while fewer exist, finds the highest and lowest values of that average, and reports where the current value sits between them: (ATR - lowest) / (highest - lowest). When the highest and lowest are equal the reading is 0.5.
How to read Average True Range Normalized (ATRN)
A reading near 1 means volatility is at or near the top of its range for the lookback, and a reading near 0 means it is as quiet as it has been. Because the scale is fixed between 0 and 1, the same thresholds work on any instrument. Some traders read very low values as compression and very high values as an already stretched move; the study itself only reports where volatility sits in its range.
The lookback is ten times the length, so with the default of 14 it compares against the last 140 bars. Early in the chart the window is shorter, and the first readings swing widely because there is little history to compare with.
Settings
- Length
- The smoothing length of the average true range. The comparison window is ten times this, so it also sets how far back the high and low are found.
Frequently asked questions
What does 0.5 mean?
Either the average true range is halfway between its highest and lowest values in the window, or the window is flat, with the highest and lowest equal, in which case the study reports the midpoint rather than dividing by zero.
How far back does it compare?
Ten times the length, so 140 bars at the default length of 14. While fewer bars exist it uses every bar so far.
Why is it useful when ATR already measures volatility?
ATR is in price units and has no fixed scale. Normalizing it inside its own range turns it into a 0 to 1 reading of whether volatility is high or low for this instrument at the latest bar, which reads the same way on any chart.