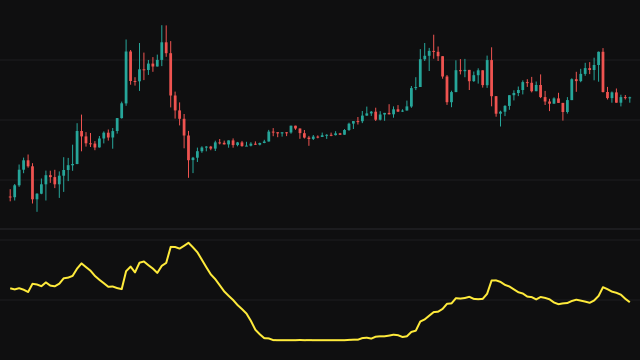
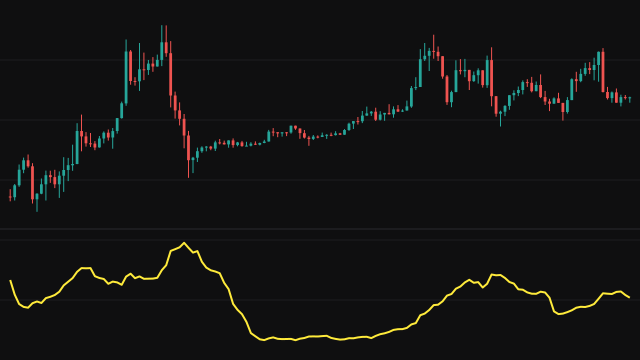
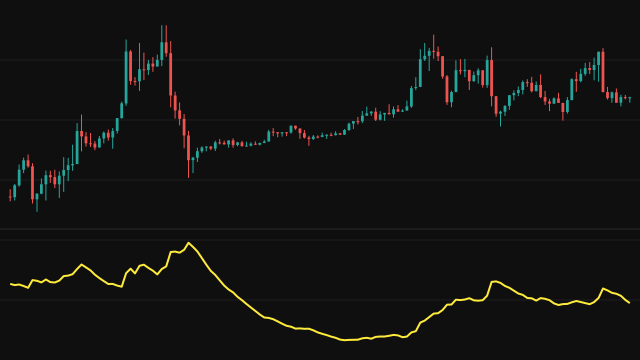
Average True Range measures volatility in price units. Each bar's true range is the largest of three distances: high to low, high to the previous close, and low to the previous close. Taking the previous close into account means a gap between bars counts as movement, which a plain high minus low would miss. On the first bar there is no previous close, so its true range is simply high minus low.
The true range is then smoothed with a running average that gives the newest bar a weight of 1 / length and keeps the rest from the previous value. That average is started from zero, and on each bar it is divided by 1 - e, where e is the weight the zero start still holds. This removes the drag of the zero start, so the line is usable from the very first bar instead of creeping up to its true level over the first length bars.
How to read Average True Range (ATR)
Read ATR as the size of a typical bar on this chart, in the instrument's own price units. A rising line means bars are getting wider and the market is moving more; a falling line means it is quietening down. Traders use it to size stops and targets, for example a stop placed two ATRs from entry, and to size positions so that each trade risks a similar amount.
ATR says nothing about direction: a strong rally and a sharp fall can show the same reading. Because it is in price units, it cannot be compared across instruments trading at very different prices; use the percent form for that.
Settings
- Length
- How many bars the average effectively covers. A shorter length reacts faster to a change in volatility, a longer one is smoother.
Frequently asked questions
Why does the line have a value from the first bar?
The average starts from zero and is divided by the share of weight it has built up so far, which removes the bias of the zero start. The early values are therefore averages of the bars seen so far rather than numbers dragged toward zero.
Why is a gap counted?
True range measures from the previous close when that is further away than the bar's own high or low. A market that gaps and then trades in a narrow range has still moved, and the true range records that move.
Can I compare ATR between two instruments?
Only if they trade at similar prices. ATR is in price units, so a higher priced instrument shows a larger ATR for the same relative movement. The Average True Range Percent study divides by the close for that comparison.