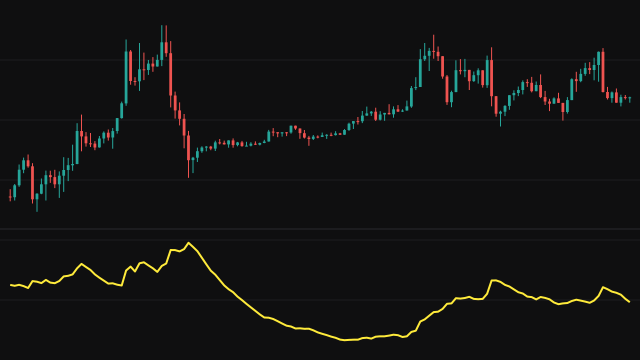
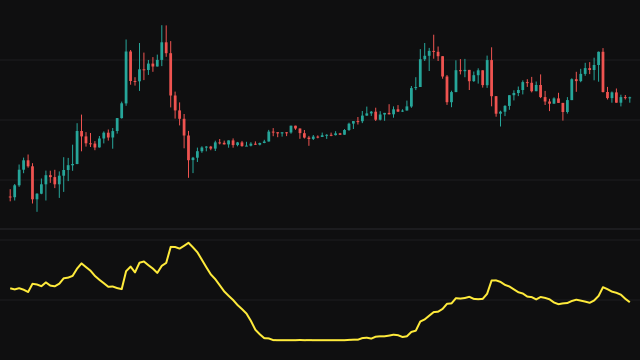
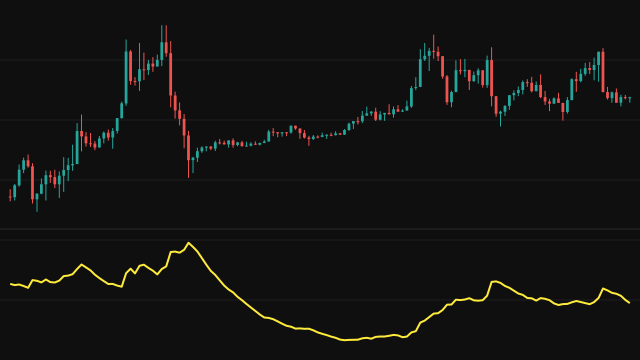
Average Daily Range measures how far price moves within a bar, without the gap component that true range adds. Each bar's range is simply its high minus its low, and a missing range is read as zero. The study then averages that range by one of three methods, chosen with the Method setting.
Method 1 is a simple mean of the last length ranges; while fewer bars exist it averages every bar so far, so it answers from the first bar. Method 2 is a running average with weight 1 / length, started from zero and divided by 1 - e (the weight the zero start still holds), which removes the bias of the zero start. Method 3 is a weighted mean with weight length on the newest bar down to 1 on the oldest, divided by the full sum of weights; bars before the start of the chart count as zero, so its first values ramp up from below.
How to read Average Daily Range (ADR)
Read ADR as the typical size of a bar in price units. On a daily chart that is the typical day's range, which traders compare with the range the current day has covered so far. On an intraday chart it is the typical bar's range.
A rising line means bars are widening, a falling line that they are narrowing. Unlike ATR it ignores gaps, so after a large gap the ADR can understate how far price actually moved. It has no direction.
Settings
- Length
- How many bars of range are averaged. A shorter length follows changes in range faster, a longer one is steadier.
- Method
- The smoothing: 1 for a simple mean, 2 for a bias-corrected running average with weight 1 / length, 3 for a linearly weighted mean that favours the newest bars.
Frequently asked questions
How is ADR different from ATR?
ADR uses only the high minus the low of each bar. ATR also measures from the previous close, so it counts gaps. On instruments that trade around the clock the two are close; where gaps are common, ATR reads higher.
Which method should I choose?
The simple mean weighs every bar in the window equally. The running average responds faster to a change and never fully forgets older bars. The weighted mean favours the newest bars but still drops a bar once it leaves the window.
Why does method 3 start low?
The weighted mean always divides by the full sum of weights, and bars before the first one on the chart count as zero, so for the first length bars it is pulled down and climbs to its true level.