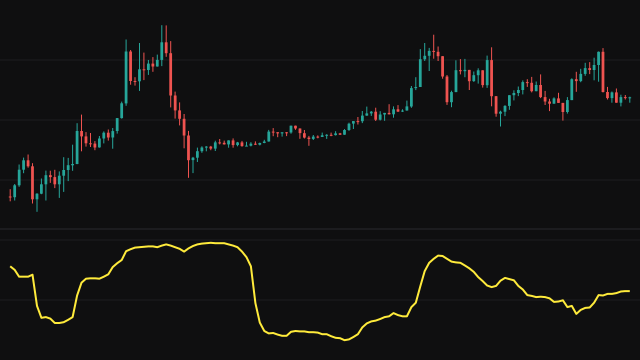
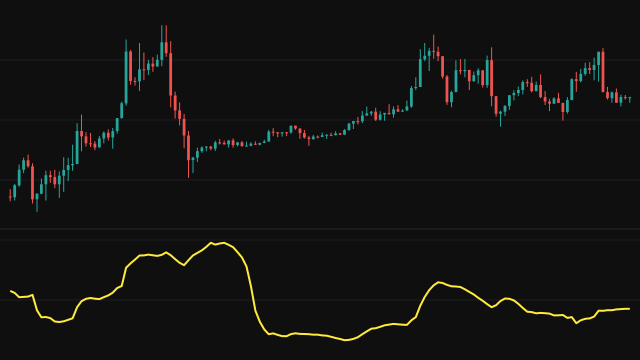
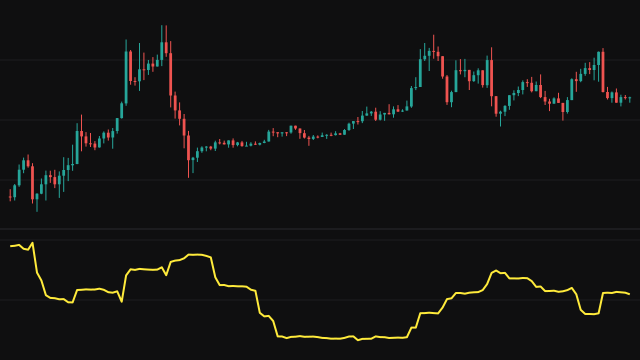
Bollinger Band Width Normalized takes the distance between deviation bands and places it on a 0 to 1 scale. The width is computed first: over the last period bars the study keeps running sums of the source and its square, takes the mean and the population standard deviation, and the width is 2 * multiplier * deviation. A missing source counts as zero, and the width is zero while the window holds a single value.
It then finds the narrowest and widest band width over the last lookback bars, or every bar so far while fewer exist, and reports (width - narrowest) / (widest - narrowest). When every width in the window is the same, the reading is 0.5.
How to read Bollinger Band Width Normalized (BBWN)
A reading near 0 means the bands are as narrow as they have been over the lookback, a squeeze, which traders watch because a larger move can follow. A reading near 1 means they are as wide as they have been, usually during a strong move. Because the scale is fixed, the same thresholds, such as below 0.1 or above 0.9, work on any instrument.
The reading is relative to the lookback only: a value of 0 says the bands are the narrowest in that window, not that they are narrow in any absolute sense. The first readings, with little history behind them, swing between the extremes.
Settings
- Period
- How many bars the mean and deviation behind each band width are measured over.
- Source
- The price series the bands are built around, the close by default.
- StdDev Multiplier
- How many deviations each band sits from the mean. It scales every width equally, so it does not change the normalized reading.
- Lookback Period
- How many past band widths the current one is compared with. A longer lookback makes extremes rarer.
Frequently asked questions
How is this different from the percentile version?
This one measures where the width sits between the narrowest and widest values in the window. The percentile version counts how many past widths are narrower. A single extreme value stretches this scale but affects the percentile only by one count.
Why does the multiplier not change the reading?
Multiplying every width by the same number moves the narrowest, the widest and the current value together, so their ratio is unchanged.
What does 0.5 on the first bar mean?
With one width there is no range to measure against, so the study reports the midpoint.