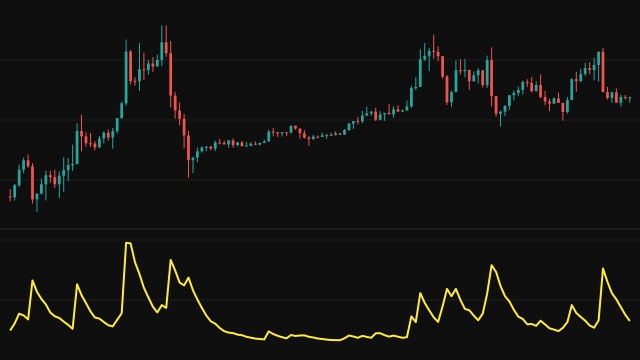
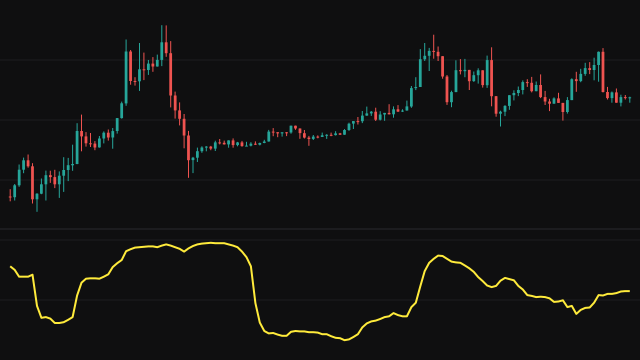
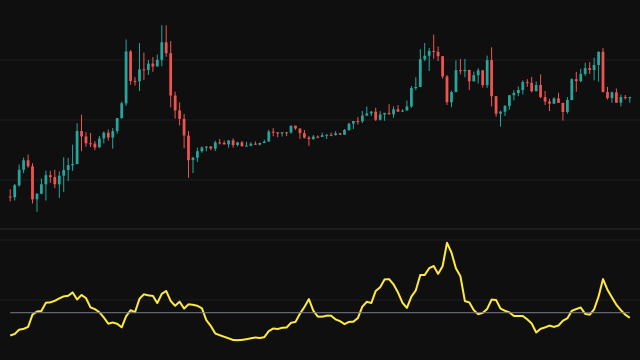
Close-to-Close Volatility reads only how far each close travelled from the one before it. For every bar it takes the log return, the natural logarithm of this close over the previous close, and keeps the returns of the last Length bars.
The squared returns in the window are added up and divided by a count of slots, and the square root of that is multiplied by the square root of 252 to put the reading on an annual scale. Two details of the calculation are worth knowing. The returns are measured about zero rather than about their own average, which on short bars makes almost no difference because the average return is tiny. And the count runs one past the window once the window is full, because the first bar, which has no return, is counted as a slot; the reading is therefore slightly smaller than a textbook standard deviation of the same returns.
The Method setting chooses what is plotted. Method 1 plots the reading as it is. Method 2 passes it through a smoothed average with weight 1 / Length, divided by the weight that average has gathered so far so it answers from the first bars. Method 3 plots the same value as method 1.
How to read Close-to-Close Volatility (CCV)
A rising line means closes are jumping further from one bar to the next, a falling line means they are bunching together. Compare the line with its own recent range rather than with a fixed number: a reading near the bottom of that range marks a quiet market, and a spike marks a burst of large moves between closes.
The 252 scale assumes daily bars. On an hourly chart the number is not an annual volatility in the usual sense, but its rises and falls still read the same way. Because only closes are used, a bar with a wide range that closes where it opened adds nothing, so this reading can understate how much price moved inside each bar.
Settings
- Length
- How many recent returns go into the window. A longer window gives a smoother, slower line.
- Method
- 1 plots the reading as computed, 2 smooths it with an average of weight 1 / Length, and 3 plots the same value as 1.
Frequently asked questions
Why is the first bar empty?
The first bar has no previous close, so it has no return to measure and the study leaves it blank.
Why does method 3 look exactly like method 1?
Method 3 applies every weight to the current reading rather than to past readings, so the weights cancel and the result equals the unsmoothed value.
Is the reading an annual percentage?
It is a fraction, not a percentage, scaled by the square root of 252. Multiply by 100 for a percentage, and remember the 252 scale is meant for daily bars.