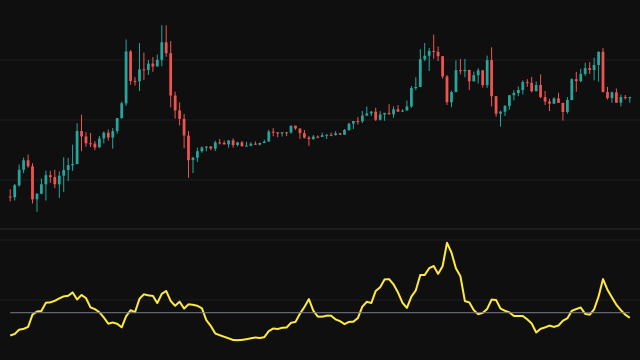
Conditional Volatility models how volatility clusters: a large move tends to be followed by more large moves, and a calm stretch by more calm. Each bar's variance is built from three parts: a constant term, alpha times the squared log return of this bar, and Beta times the previous bar's variance.
The log return is the natural logarithm of this close over the previous close, held within 20 percent either way so a single gap cannot swamp the model. During the first Length bars the study averages the squared returns to estimate a long run variance. On bar Length that level fixes the constant term as (1 - alpha - beta) times the long run variance, which is what pulls the estimate back towards its usual level over time.
The model stays stable only while alpha plus beta is below 1, so when the two settings add up to 1 or more the study holds beta just under that line. The plotted value is the square root of 252 times the variance, times 100.
How to read Conditional Volatility (CV)
Read the line as the market's current volatility regime. It jumps after a large return, then decays towards its long run level at a pace set by beta: a high beta lets a shock linger for many bars, a low beta lets it fade quickly. A line that keeps climbing means large moves are arriving one after another.
The first bars use only a short running average, so the line settles once the first Length bars have passed. The 252 scale assumes daily bars; on an intraday chart treat the number as a relative reading, not an annual figure.
Settings
- Length
- How many opening bars are averaged to estimate the long run variance that anchors the model.
- alpha
- Weight on the latest squared return. Higher values make the line react more sharply to each new move.
- Beta
- Weight on the previous variance. Higher values make a shock fade more slowly. It is held so that alpha plus beta stays below 1.
Frequently asked questions
What happens if alpha plus beta reaches 1?
The model would no longer return to a long run level, so the study lowers beta to just under 1 minus alpha before using it.
Why are returns capped at 20 percent?
A single very large gap would dominate the variance for many bars. Holding each return within 20 percent either way keeps one bar from overwhelming the estimate.
How is the line computed during the first Length bars?
Until bar Length the constant term is zero. Each bar's variance is alpha times its squared return plus beta times the running average of the squared returns so far. On bar Length that average becomes the long run level, the constant term is fixed from it, and the full model runs from then on.