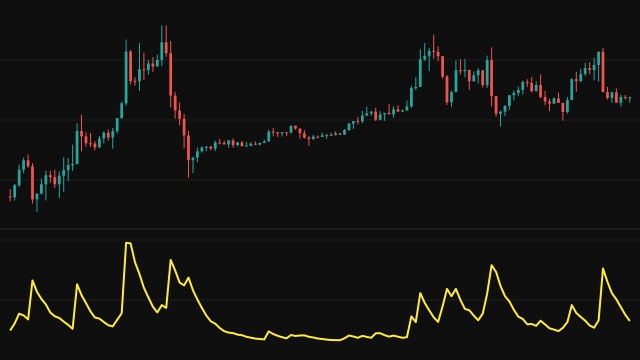
Chaikin's Volatility tracks how quickly the size of bars is changing. Each bar's range is its high minus its low, with a missing range read as zero. That range is smoothed with an exponential average of weight 2 / (smoothLength + 1). On the first bar the average starts from that bar's range divided by the smoothing length, as if the bars before the chart had no range, so the first stretch of values climbs from below.
The reading is the percentage change of the smoothed range over rocLength bars: (average - average rocLength bars ago) / average rocLength bars ago * 100. It is empty for the first rocLength bars, while there is no older average to compare with. A grey zero line is drawn for reference.
How to read Chaikin's Volatility (CVI)
A positive reading means the smoothed range is wider than it was rocLength bars ago, so bars are expanding; a negative reading means they are contracting. Sharp rises often appear as a market accelerates into a move or a sell-off, and long stretches below zero describe a market that is quietening down.
The study measures change in range, not its level, and not direction: a strong rally and a sharp fall both push it up. Ignore the first stretch of readings after the start of the chart, where the average is still climbing from its low starting value and the reading is inflated.
Settings
- ROC Length
- How many bars back the smoothed range is compared with. A longer length measures a slower change in volatility.
- Smoothing Length
- How heavily the high-low range is smoothed before its change is measured. A longer length gives a steadier, slower reading.
Frequently asked questions
Why are the first readings so large?
The average starts from the first bar's range divided by the smoothing length, which is far below a normal range, and climbs from there. Comparing the climbing average with its own earlier, lower values gives large positive changes until it settles.
Does a high reading mean price is rising?
No. It means bar ranges are widening. That happens in fast falls as often as in fast rallies.
What is the grey line?
A fixed zero reference. Above it the smoothed range is wider than it was rocLength bars ago; below it the range is narrower.