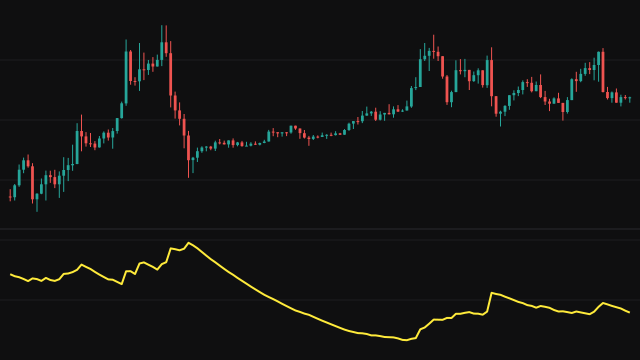
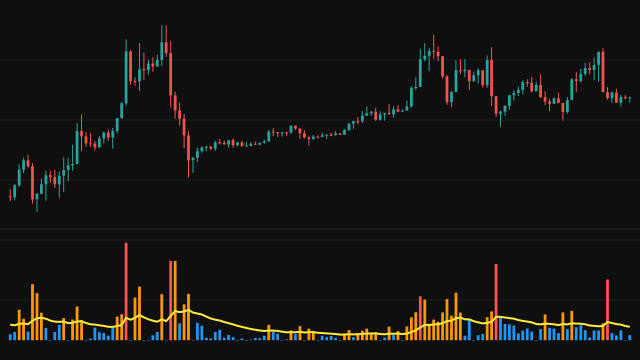
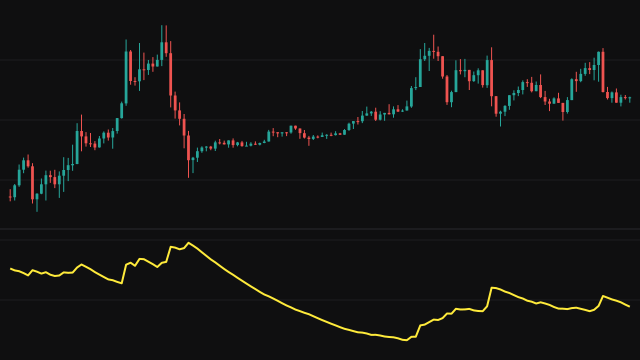
Exponential Weighted MA Volatility estimates volatility by giving every past return a weight that decays smoothly, rather than counting the returns in a fixed window equally and then dropping them. For each bar it takes the log return of the source, the natural logarithm of this value over the previous one, and squares it. The first bar has no previous value and reads a return of zero.
The squared returns are smoothed with an average of weight 1 / Length, seeded with the first squared return. Early on that average still carries much of its seed, so the study divides it by the weight it has gathered so far, which offsets most of the start-up bias and makes the reading usable from the first bars. The square root of the result is the volatility per bar, and with Annualize Volatility on it is multiplied by the square root of Annual Periods.
How to read Exponential Weighted MA Volatility
A rising line means returns are getting larger, a falling line means the market is calming down. Because old returns fade gradually rather than dropping out of a window all at once, the line has none of the sudden steps a rolling standard deviation shows when a large return leaves its window.
Compare the line with its own history rather than with a fixed number. A spike after a shock decays at a pace set by Length. Set Annual Periods to the number of bars in a year on your chart if you want a true annual figure; the default of 252 suits daily bars.
Settings
- Source
- The price series whose returns are measured, the close by default.
- Length
- Sets the smoothing weight 1 / Length. A longer length remembers returns for more bars and gives a steadier line.
- Annualize Volatility
- When on, the per-bar volatility is multiplied by the square root of Annual Periods.
- Annual Periods
- Bars in a year used for annualising: 252 for daily bars, 52 for weekly bars.
Frequently asked questions
How is this different from a rolling standard deviation?
Every past return keeps a weight that shrinks over time instead of counting fully and then vanishing, so the line reacts quickly to new moves and has no steps when an old return leaves the window.
Why is the line usable from the first bars?
The smoothed average is divided by the weight it has gathered so far, which removes the bias of the start and gives a fair reading early on.
Is the average return subtracted?
No. The squared returns are averaged about zero, which is the usual choice for short bars where the average return is tiny.