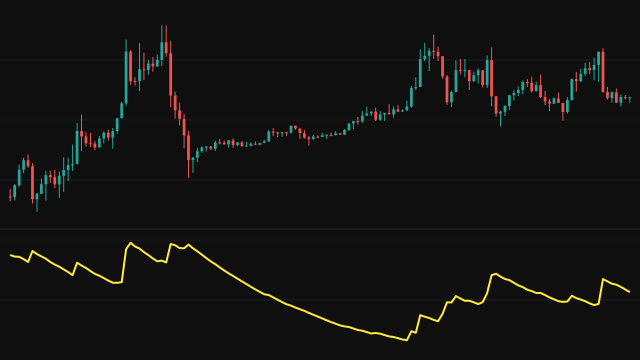
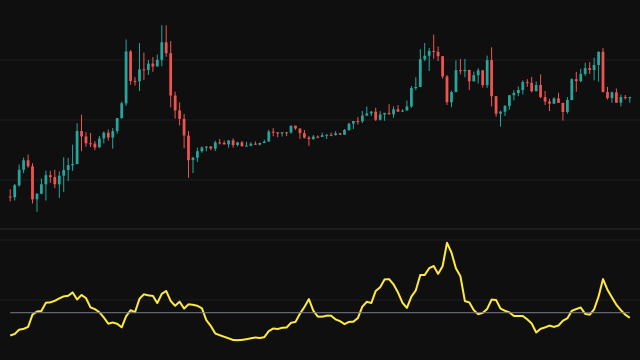
Elder's Thermometer measures how far a bar pushes outside the bar before it. For each bar it takes the distance between this high and the previous high, and between the previous low and this low, and keeps the larger of the two. An inside bar, one whose high is below the previous high and whose low is above the previous low, reads zero. The first bar compares against itself and reads zero as well.
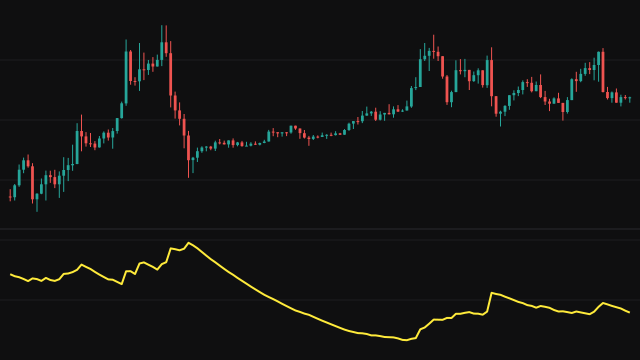
The signal line is an exponential mean of the reading with weight 2 / (EMA Period + 1). It starts from zero and is divided by the weight it has gathered so far, so it gives a usable value from the first bar instead of rising slowly from zero.
The histogram is coloured bar by bar: red when the reading is at least Explosive Threshold times the signal line, orange when it is at or above the signal line, and blue otherwise.
How to read Elder's Thermometer (ETHERM)
Blue bars are bars whose reach beyond the previous bar is below its recent average, as in a quiet market where bars stay mostly inside each other. Orange bars reach at least as far as that average. Red bars reach at least Explosive Threshold times the average: an unusually large push in one bar, which a trader may read as a sign that a quiet stretch has ended or that a move is stretched.
A run of low readings means the bars are overlapping and the range is compressing. The reading is in price units, so its size depends on the instrument and is best compared with the signal line rather than with a fixed number. It shows the size of a push, not its direction, and it says nothing about what the next bar will do.
Settings
- EMA Period
- Length of the exponential signal line. A longer period gives a steadier baseline that reacts more slowly.
- Explosive Threshold
- How many times the signal line a bar must reach to be coloured red. Lower values mark more bars as explosive.
Frequently asked questions
Why do some bars read exactly zero?
An inside bar, whose high is below the previous high and whose low is above the previous low, reads zero by definition, and so does the first bar.
What do the three colours mean?
Blue is below the signal line, orange is at or above it, and red is at least the Explosive Threshold times the signal line.
Does it show direction?
No. It uses the larger of the upward and downward reach, so an explosive bar can be a jump up or a drop down. Read direction from the price bars.