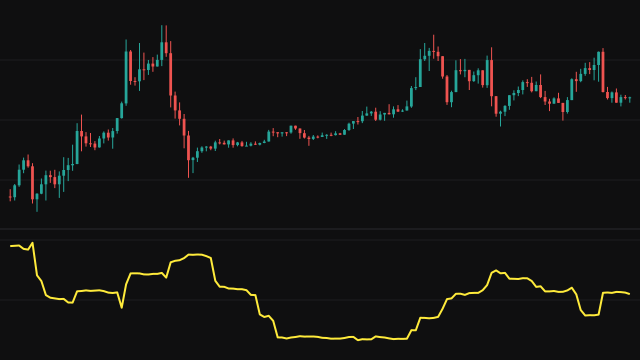
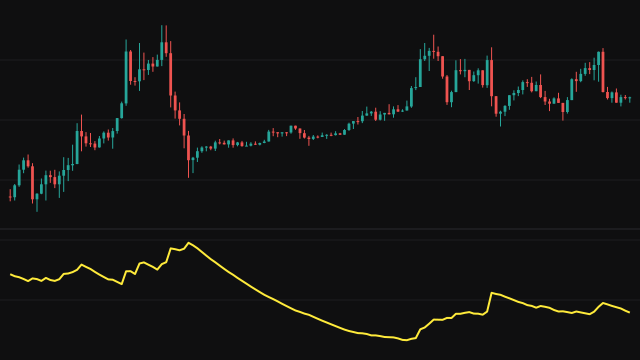
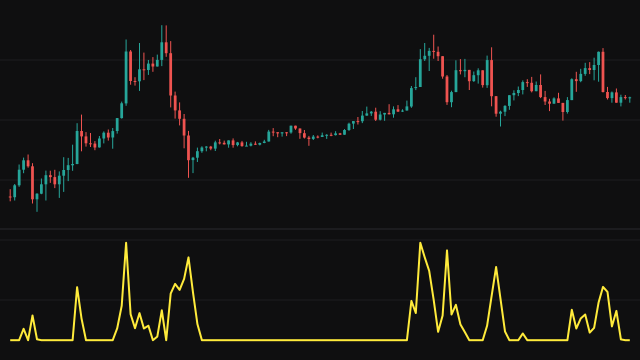
High-Low Volatility estimates volatility from the distance between each bar's high and low. For each bar it takes the log range, the natural logarithm of the high minus that of the low, squares it and multiplies it by 0.3606737602, which is 1 / (4 ln 2). That constant turns the squared range into an estimate of the variance of returns.
The estimate is smoothed with an average of weight 1 / Length, seeded with the first bar's value. Early on that average still leans on its seed, so the study divides it by the weight it has gathered so far, which removes the start-up bias. The square root of the result is the volatility per bar, and with Annualize Volatility on it is multiplied by the square root of Annual Periods.
How to read High-Low Volatility (HLV)
A rising line means bars are getting wider, a falling line means they are tightening. Because it measures the full range of every bar, it responds to a market that swings back and forth inside each bar even when closes hardly change.
Read it against its own past values. A stretch near its lows marks narrow bars, and a spike marks a burst of wide bars. The default 252 periods suits daily bars; set Annual Periods to the bars in a year on your chart, or switch annualising off to read a per-bar figure. Gaps between one close and the next open are not included.
Settings
- Length
- Sets the smoothing weight 1 / Length. A longer length gives a smoother, slower line.
- Annualize Volatility
- When on, the per-bar volatility is multiplied by the square root of Annual Periods.
- Annual Periods
- Bars in a year used for annualising: 252 for daily bars, 52 for weekly bars.
Frequently asked questions
Why the constant 1 / (4 ln 2)?
It is the factor that turns the average squared log range into an estimate of the variance of returns when prices move as a random walk without drift, so the result is on the same scale as a close-to-close volatility.
How does it differ from Parkinson Volatility in this library?
Both use the same squared log range. This one seeds its average with the first bar and corrects the start-up bias, so it answers from the first bar; Parkinson Volatility waits until its window is full.
Does it see gaps?
No. It only uses each bar's high and low, so a jump between bars does not raise the reading.