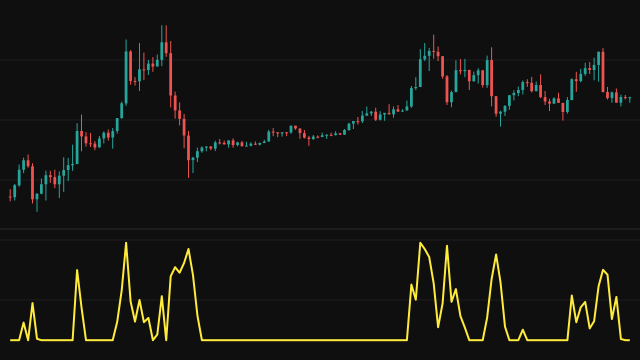
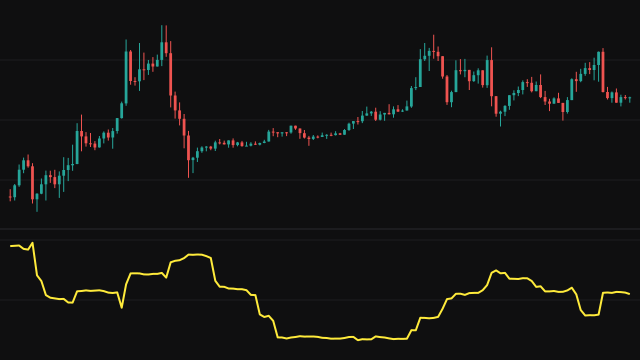
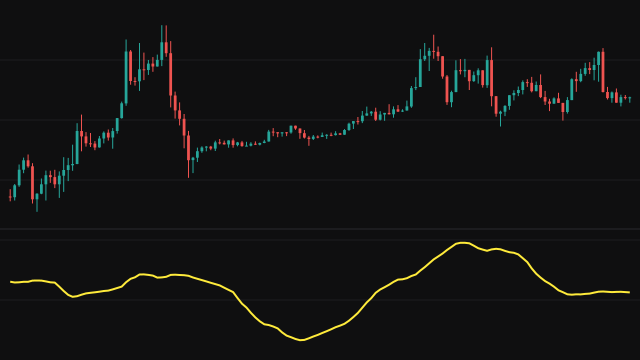
This study shows the volatility term that drives an adaptive moving average. It keeps two bands that follow the source: on each bar it measures how far the source sits from the upper band and from the lower band, and the larger distance is that bar's raw volatility.
The raw volatility is summed over a ten bar window, scaled by a factor that depends on Period, and then smoothed by a slow exponential mean whose weight is 2 / (max(4 times Period, 65) + 1). The plotted value is the raw volatility divided by that smoothed average, floored at 1 and capped at a ceiling that also depends on Period.
The ratio feeds back into the bands: when it is high the bands are pulled towards the source faster, so the next bar's distances are measured from a tighter reference. A bar that sets a new extreme moves the band to the source outright.
How to read Jurik Volatility (JVOLTY)
A reading of 1 means price is moving at or below its usual pace. Readings above 1 mean the latest move is larger than the recent average, and the higher the line, the more unusual the move. The line cannot rise above its cap, which is about 2.8 at the default period, so sustained readings near the top mark strong expansion.
Use it to tell quiet stretches from active ones. It does not show direction. Because the smoothing is slow, the line can stay at 1 for long periods and then jump when activity returns.
Settings
- Period
- Sets the band adaptation speed, the slow smoothing weight and the cap on the ratio. Larger periods give a slower average and a lower cap: about 6.3 at a period of 5, 2.8 at 10 and 2.2 at 20.
- Source
- The price series the bands follow, the close by default.
Frequently asked questions
Why does the line sit at exactly 1 so often?
The ratio is floored at 1, so any bar that moves no more than the smoothed average reads 1. The one exception is a Period of 1, where the cap works out to zero and the line reads 0 from the second bar on.
What sets the upper limit?
The cap is computed from Period. At the default of 10 it is about 2.8; shorter periods allow a higher ceiling and longer periods a lower one.
Does a high reading mean price is going up?
No. It measures how far price moved from its adaptive bands in either direction, so a sharp drop reads as high as a sharp rise.