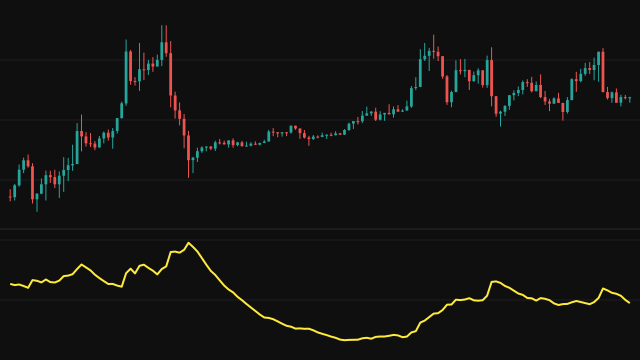
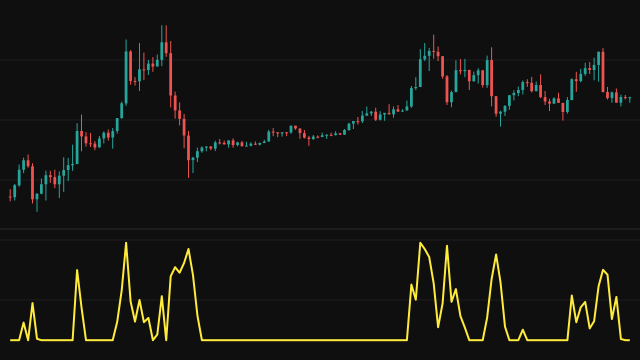
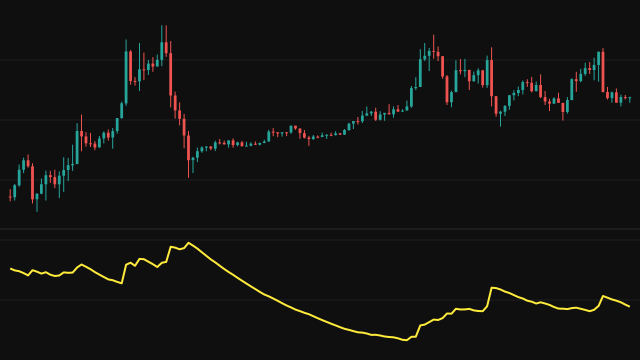
The Mass Index watches the width of each bar, the high minus the low, for signs that the range is expanding. It smooths the range with an exponential mean of weight 2 / (EMA Length + 1), then smooths that mean again with the same weight. Both means start from zero, so during the first bars each is divided by the weight it has gathered so far; once that start-up weight falls below a tiny threshold the correction is dropped.
The ratio of the single mean to the double mean is above 1 when the range is widening, because the single mean responds first, and below 1 when it is narrowing. The study adds up that ratio over the last Sum Length bars. With the defaults the line hovers near 25, the value it would read if the range were steady, and the line is empty until Sum Length bars have passed.
How to read Mass Index (MASSI)
A rising line means bar ranges are widening, a falling line means they are contracting. A common reading watches for a bulge: the line rising through a high level and then falling back, which suggests the range expansion is ending and the current trend may be about to reverse.
The line says nothing about direction. Use a trend tool or price itself to decide which way a possible reversal would go. Levels depend on Sum Length, since the line is centred near that number.
Settings
- EMA Length
- Length of both exponential means of the range. A longer length reacts more slowly to changes in bar width.
- Sum Length
- How many bars of the ratio are added up. It also sets the level the line hovers around, which equals this number.
Frequently asked questions
Why does the line hover near 25?
When the range is steady the single and double means are equal and the ratio is 1, so the sum over 25 bars is 25.
Does it tell me which way price will turn?
No. It measures only the width of the bars, so you need price or a trend tool to judge direction.
Why is the line empty at the start?
The sum needs Sum Length bars of the ratio before it has a full window to add up.