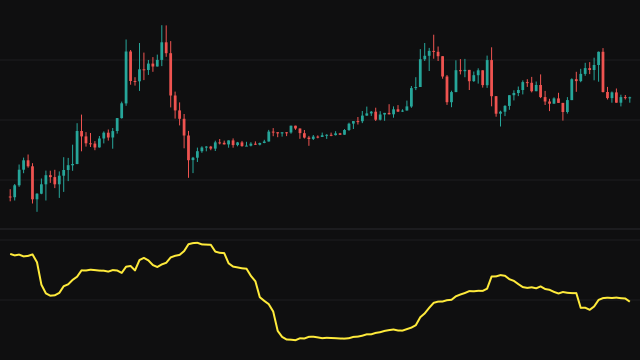
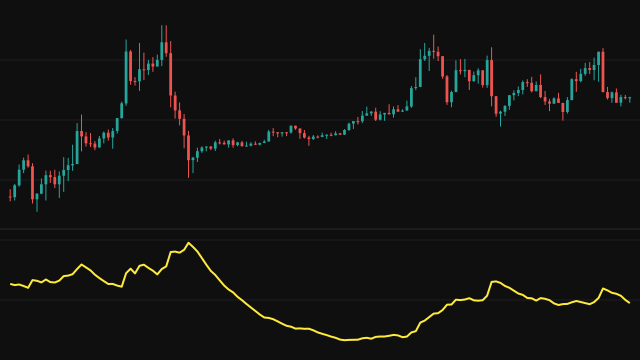
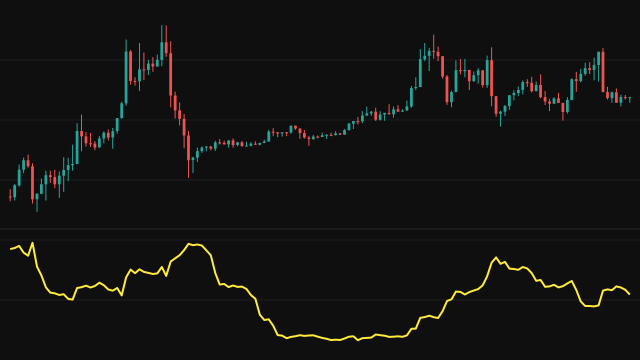
Parkinson Volatility estimates volatility from each bar's range instead of from close-to-close returns. For each bar it takes the natural logarithm of the high over the low and squares it; a bar whose high equals its low contributes zero.
The squared values are smoothed with a running average of weight 1 / Length, seeded with the simple average of the first Length values, so the line is empty until a full window has passed. The smoothed value is divided by 4 ln 2, which puts it on the scale of the variance of returns, and the square root gives the volatility per bar. With Annualize Volatility on it is multiplied by the square root of Annual Periods.
How to read Parkinson Volatility (PV)
A rising line means bar ranges are widening relative to price, a falling line means they are narrowing. Because every bar's full range is used, it picks up a market that swings within each bar even when the closes barely move, and it settles with fewer bars than a close-to-close measure.
Read it against its own history: readings near its lows mark narrow bars, and spikes mark bursts of wide bars. Gaps between one close and the next open are not measured, so on instruments that gap often it can understate the total movement. The default 252 periods suits daily bars.
Settings
- Length
- Length of the smoothing average. A longer length gives a smoother line and a longer empty stretch at the start.
- Annualize Volatility
- When on, the per-bar volatility is multiplied by the square root of Annual Periods.
- Annual Periods
- Bars in a year used for annualising: 252 for daily bars, 52 for weekly bars.
Frequently asked questions
Why is the line empty for the first bars?
The smoothing average is seeded with the simple average of the first Length values, so it has no value until that many bars have passed.
Why divide by 4 ln 2?
That factor converts the average squared log range into an estimate of the variance of returns, so the result is comparable with other volatility measures.
How is it different from High-Low Volatility (HLV)?
Both use the squared log range. High-Low Volatility answers from the first bar with a bias correction, while this one waits for a full window before its first value.