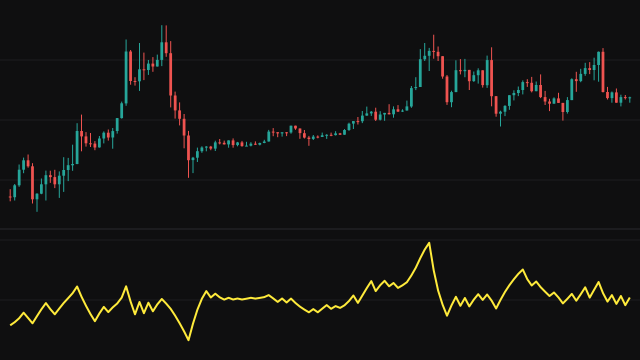
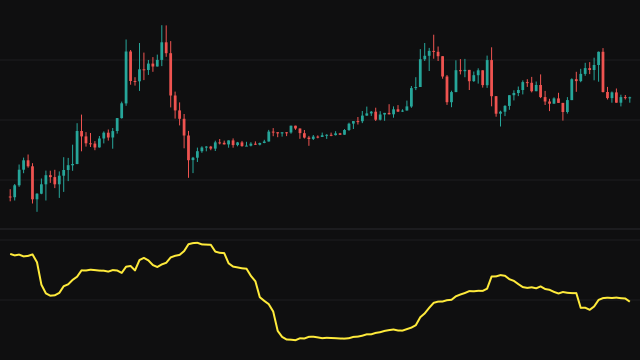
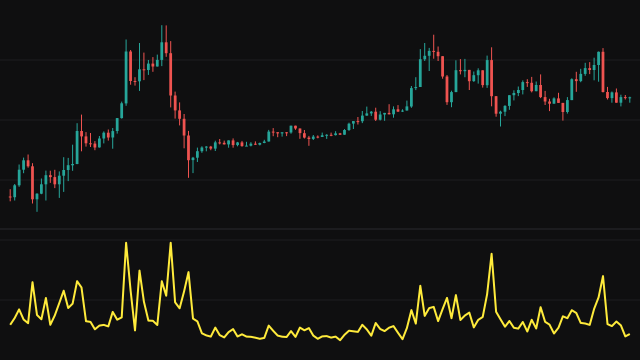
Realized volatility measures how much price has actually moved, as opposed to how much the market expects it to move. On each bar the study takes the log return from the previous close to this close, squares it to get the bar's realized variance, and takes the square root to get the bar's volatility, which is the size of the return without its sign.
Those per-bar values are smoothed with a simple moving average over the smoothing length. With annualising switched on the average is multiplied by the square root of the number of periods in a year. The first bar has no previous close, so the line begins once a full window of returns exists.
How to read Realized Volatility (RV)
The line shows the typical size of a bar's move over the recent window. A rising line means bars are moving further from close to close; a falling line means the market is settling.
Each bar contributes one close-to-close return, so a single large bar lifts the line for exactly the smoothing length and then drops out. The yearly figure is only as right as the Annual Periods value you give for your timeframe.
Settings
- Smoothing Length
- How many per-bar volatilities the simple average covers. A longer length gives a smoother, slower line.
- Annualize Volatility
- When on, multiplies the result by the square root of the annual periods so it reads as a yearly figure.
- Annual Periods
- How many bars of this timeframe make a year, used only when annualising, for example 252 on a daily chart or 52 on a weekly one.
Frequently asked questions
Why do the first bars show nothing?
The first bar has no previous close and so no return. The line starts once the smoothing window holds that many returns.
Is this the same as a standard deviation of returns?
No. It averages the absolute size of each return rather than measuring the spread around the mean return. A steady trend therefore counts in full here, while a standard deviation would subtract it as the mean.
What does the annualised number mean?
It scales the per-bar figure up to a year by the square root of the number of periods, so it can be compared with yearly volatility figures quoted elsewhere.