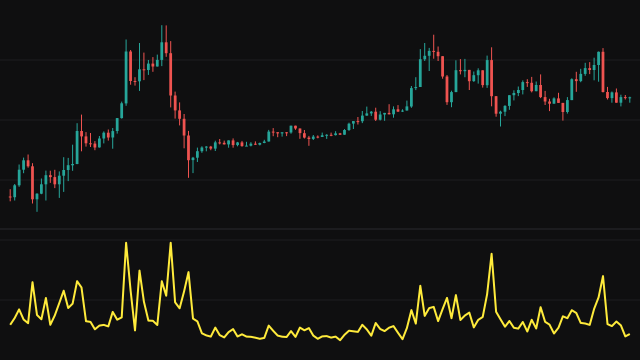
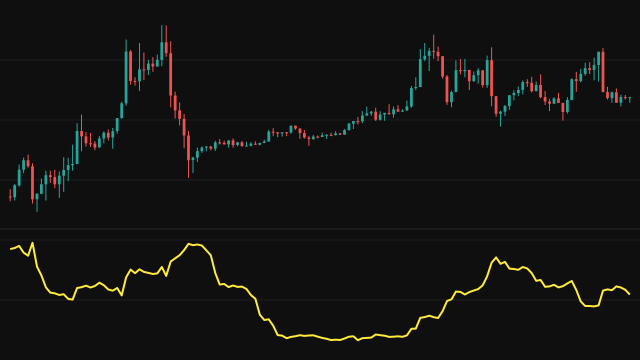
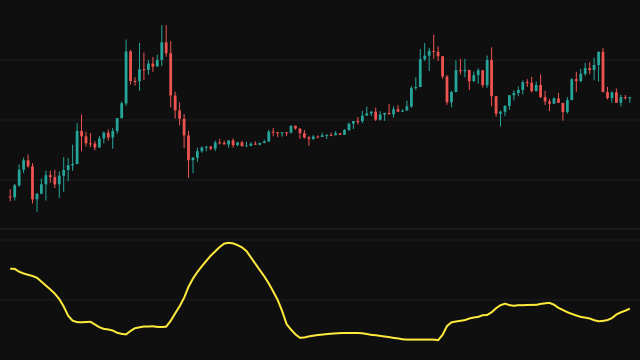
The Relative Volatility Index applies the logic of the relative strength index to volatility instead of price change. It asks whether the market's volatility is showing up on up bars or on down bars.
On each bar the study computes a population standard deviation of the source over a window that grows to the StdDev length. If the source rose from the previous bar, that deviation is counted as upward volatility; if it fell, as downward volatility; an unchanged bar and the first bar count neither. The two series are each smoothed with a Wilder average started from zero and corrected for that start. The result is 100 times the upward average divided by the sum of both, and 50 when there is nothing to divide.
How to read Relative Volatility Index (RVI)
Above 50, volatility has come mostly on rising bars; below 50, mostly on falling bars. Readings near the extremes mean almost all the recent volatility arrived in one direction. It can serve as a filter on other signals, for example taking long setups only while it is above 50.
It measures where volatility occurred, not how much there was, so a quiet market can still read near an extreme. The first bars rest on a short window and settle as the averages fill.
Settings
- Source
- The price series whose changes and standard deviation are measured.
- StdDev Length
- How many bars the standard deviation covers once its window has filled.
- RMA Length (Wilder's Smoothing)
- How many bars the Wilder averages of upward and downward volatility span. A longer length gives a smoother line.
Frequently asked questions
How is it different from the RSI?
The RSI averages the size of each price change. This index averages the standard deviation instead, crediting it to the up or down side by the direction of the bar.
Why does it start at 50?
On the first bar there is no previous value and no deviation, so neither side has anything and the reading is set to the midpoint.
Does a high reading mean high volatility?
No. It means the volatility that occurred came mostly on rising bars. The amount of volatility is not shown.