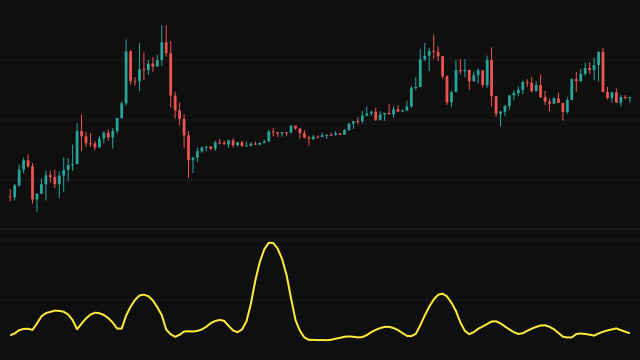
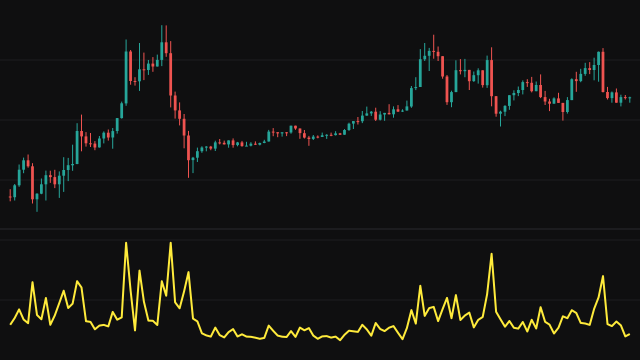
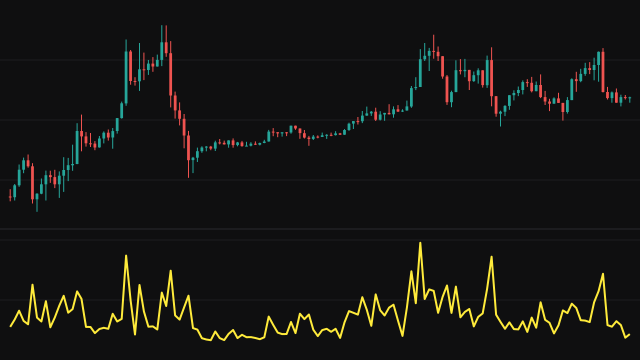
The Ulcer Index measures how deep and how long price has been below its recent high. Unlike most volatility measures it only counts falls: a market that rises steadily, however quickly, reads close to zero.
On each bar the study finds the highest source value over the last period bars (or over every bar so far while fewer exist) and the percentage drawdown of the source from that high. It squares the drawdown, averages the squares over the last period bars and takes the square root. Deep drawdowns weigh far more than shallow ones because they are squared, and long drawdowns weigh more because they fill more of the window.
How to read Ulcer Index (UI)
Zero means price has been at a new high on every bar of the window. Higher readings mean price has been sitting below its recent peak, further and for longer. The value is in percent, so it can be compared across instruments with very different prices.
Use it to judge how uncomfortable holding the instrument has been recently, or to compare the downside of two markets. It says nothing about direction going forward, and a sharp rally after a fall keeps the reading high until the old drawdown bars leave the window.
Settings
- Source
- The price series whose drawdown from its recent high is measured.
- Period
- How many bars the recent high and the average of squared drawdowns cover.
Frequently asked questions
Why does a strong uptrend read near zero?
The index only measures how far price sits below its recent high. In a steady rise price keeps making new highs, so the drawdown on each bar is zero or small.
What unit is the value in?
Percent. A reading of 3 means the typical drawdown over the window, weighted toward the deeper ones, was about 3 percent below the recent high.
Why are the first bars empty?
The average of squared drawdowns needs a full window of period bars, so the line starts on the bar that completes the first window.