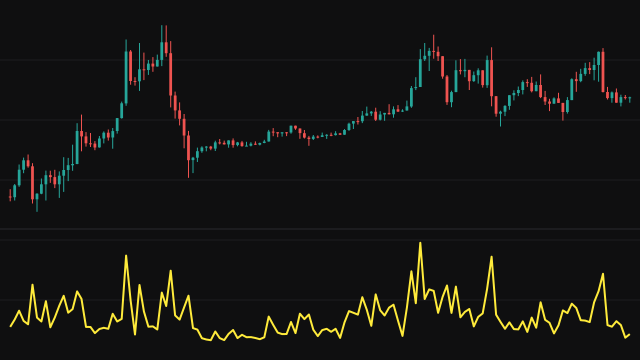
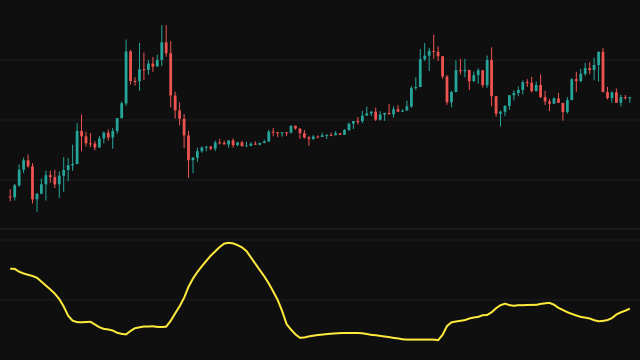
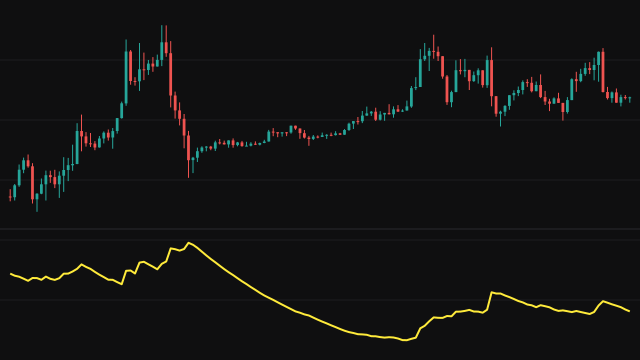
Volatility of volatility asks how stable the market's volatility is. A market can be very volatile in a steady way, or swing between calm and wild; this study separates the two.
First it computes a rolling population standard deviation of the source over the volatility period. Then it computes a second rolling population standard deviation, over the VOV period, of that volatility series. Both windows grow from the first bar until they are full, a missing value counts as zero, and a window holding a single value reads 0, so the line starts at zero on the first bar.
How to read Volatility of Volatility (VOV)
A low reading means volatility has been roughly constant over the recent window, whatever its level. A rising reading means volatility is shifting, for example as a quiet market breaks out or a busy one calms down.
The value is in the source's price units, so compare it with its own history on the same chart. The first bars rest on short windows and are less reliable until both windows have filled.
Settings
- Source
- The price series whose volatility is measured.
- Volatility Period
- How many bars the first standard deviation, the volatility itself, covers.
- VOV Period
- How many bars the second standard deviation, of the volatility series, covers.
Frequently asked questions
How is this different from a plain volatility measure?
A plain measure tells you how much price moves. This tells you how much that amount of movement is itself changing.
Why does the line start at zero?
Both standard deviations read 0 while their window holds a single value, so the first bar is 0 and the early bars use short windows.
Which standard deviation does it use?
The population form, dividing by the number of values in the window rather than one less.