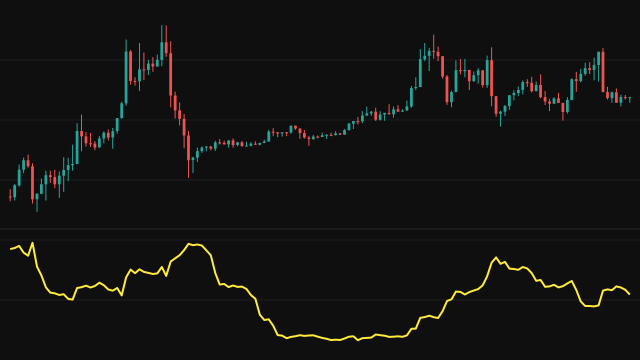
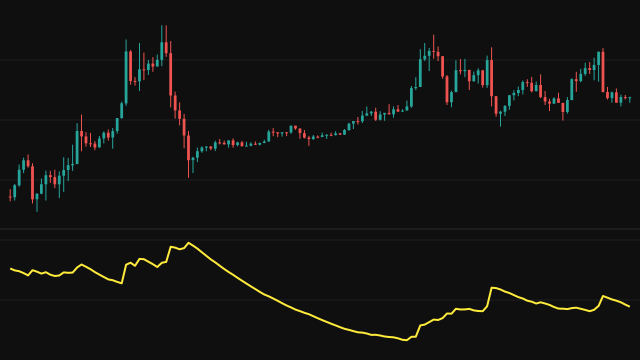
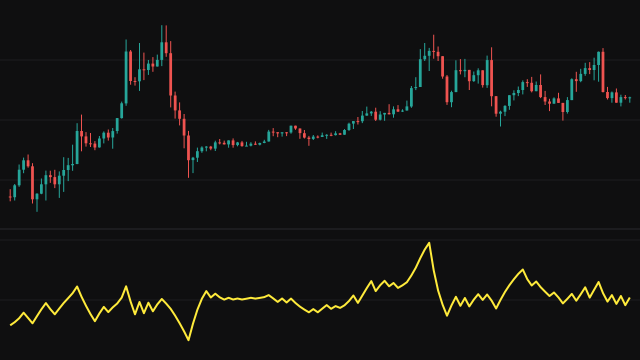
Rogers-Satchell volatility estimates how much price is fluctuating using all four prices of each bar rather than only the close. Its useful property is that a steady trend does not inflate it: the formula is built so that a persistent drift up or down cancels out, leaving the fluctuation around it.
For every bar the study takes logarithms of price ratios: the log of high over open times the log of high over close, plus the log of low over open times the log of low over close. That is the bar's variance. Prices are floored at a tiny positive number so the logarithms stay defined. A simple moving average of the variance over length bars is taken, and its square root is the volatility. With annualising switched on the result is multiplied by the square root of the number of periods in a year.
How to read Rogers-Satchell Volatility (RSV)
The value is a volatility per bar, or per year when annualised. A rising line means bars are swinging more widely within themselves; a falling line means the market is calming. Compare it with its own history on the same chart to judge whether volatility is high or low.
The estimate ignores the gap between one bar's close and the next bar's open, so it understates volatility on a market that gaps often. The annualising factor assumes the number you give for periods in a year matches your chart's timeframe.
Settings
- Length
- How many bars the per-bar variance is averaged over before the square root is taken.
- Annualize Volatility
- When on, multiplies the result by the square root of the annual periods so it reads as a yearly figure.
- Annual Periods
- How many bars of this timeframe make a year, used only when annualising, for example 252 on a daily chart.
Frequently asked questions
Why use this instead of the standard deviation of closes?
It uses the open, high, low and close of each bar, so it draws more information from the same number of bars, and a steady trend does not raise it.
What should Annual Periods be on an hourly chart?
The number of hourly bars in a year for that market. A market that trades around the clock has 24 times 365, or 8760. A market with seven hourly bars a day on 252 trading days has 1764.
Does it include overnight gaps?
No. Every term is measured inside a single bar, so the move between one close and the next open is not counted.