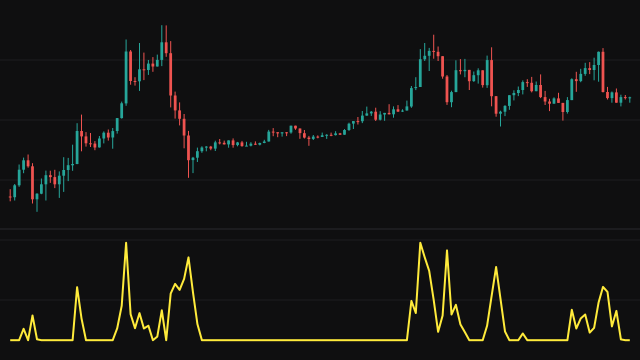
This study takes the adaptive volatility ratio of an adaptive moving average and squashes it into a bounded range. The ratio is built from two bands that follow the source: on each bar the larger distance from the source to either band is the raw volatility. That raw value is summed over ten bars, scaled by a factor that depends on Period, and smoothed by a slow exponential mean. The ratio is the raw volatility over that average, floored at 1 and capped at a ceiling set by Period.
The plotted value is 1 / (1 + e^(-1.5 (ratio - 1))). A ratio of 1 gives exactly 0.5, and larger ratios rise towards 1 along a smooth curve. As with the unbounded version, the ratio feeds back into the bands, pulling them towards the source faster when movement is high.
How to read Normalized Jurik Volatility (JVOLTYN)
A reading of 0.5 means price is moving at or below its usual pace, which is where the line spends most of its time. Rises above 0.5 mark bars that moved further than the recent average, and readings near 0.94 mark the strongest expansion the cap allows at the default period.
The bounded scale makes it easy to set fixed thresholds or to compare instruments. It does not show direction, and because the underlying average is slow the line can rest at 0.5 for long stretches before jumping when activity returns.
Settings
- Period
- Sets the band adaptation speed, the slow smoothing weight and the cap on the ratio before it is squashed.
- Source
- The price series the bands follow, the close by default.
Frequently asked questions
Why does the line never fall below 0.5?
The underlying ratio is floored at 1, and the logistic curve maps a ratio of 1 to exactly 0.5. At a Period of 1 the cap on the ratio works out to zero, so from the second bar on the ratio is 0 and the line reads about 0.18.
How high can it go?
It is limited by the cap on the ratio. At the default period of 10 the ratio stops near 2.8, which maps to roughly 0.94.
How is this different from Jurik Volatility (JVOLTY)?
The calculation is the same; this version passes the ratio through a logistic curve so it stays between 0.5 and 1 instead of running from 1 up to its cap.