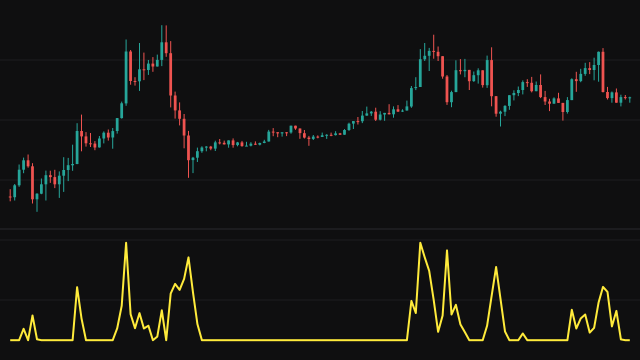
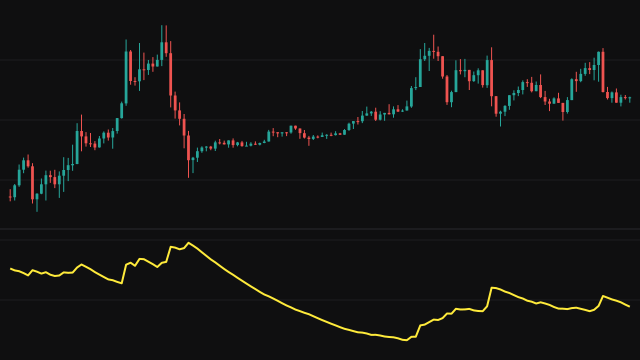
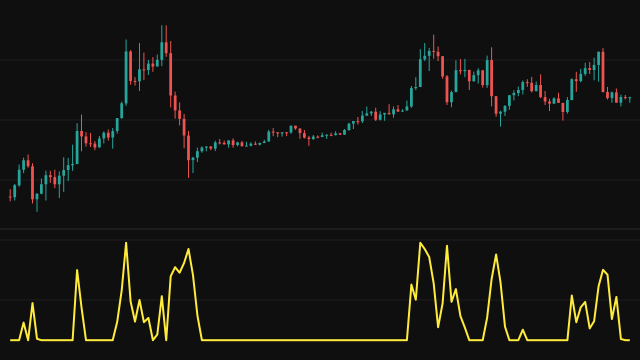
Historical Volatility is the classic realised volatility measure. For each bar it takes the log return of the source, the natural logarithm of this value over the previous one, and keeps the last Length returns.
It then takes the population standard deviation of those returns: the average of the squared returns minus the square of their average, floored at zero, and the square root of that. Until the window is full it uses the returns available, so the line starts on the second bar, reading zero while there is only one return. With Annualize Volatility on, the result is multiplied by the square root of Annual Periods.
How to read Historical Volatility (HV)
A rising line means returns are becoming more spread out, a falling line means the market is calming. Compare the reading with its own history: a stretch near the bottom of its range marks a calm market, and a spike follows a burst of large returns.
Every return in the window counts equally and drops out all at once when it leaves, so a single large bar lifts the line for exactly Length bars and then lets it fall in one step. The default 252 periods suits daily bars; on other timeframes set Annual Periods to the bars in a year or switch annualising off.
Settings
- Source
- The price series whose returns are measured, the close by default.
- Length
- How many recent returns go into the standard deviation. A longer window gives a smoother, slower line.
- Annualize Volatility
- When on, the standard deviation is multiplied by the square root of Annual Periods.
- Annual Periods
- Bars in a year used for annualising: 252 for daily bars, 52 for weekly bars.
Frequently asked questions
Why does the line drop suddenly sometimes?
A large return leaves the window all at once after Length bars, so the standard deviation falls in a single step on that bar.
Is it a sample or a population standard deviation?
Population: the squared deviations are divided by the number of returns, not by one less.
Why is it zero on the second bar?
With a single return there is nothing to spread around, so the standard deviation is zero until a second return arrives.