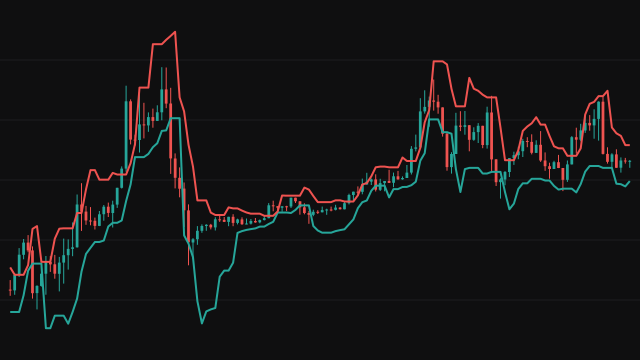
The Chandelier Exit, described by Charles LeBeau, hangs a stop from the extreme of a recent move, the way a chandelier hangs from a ceiling. The long stop is the highest high of the last ATR Period bars minus ATR Multiplier times the average true range over the same number of bars. The short stop is the lowest low of those bars plus the same distance. The average true range is Wilder's smoothed average of the true range, so the stops widen when bars grow and tighten when they shrink.
The study keeps track of one side at a time. It starts long on the first bar the stops exist. While long, a close below the previous bar's long stop turns it short; while short, a close above the previous bar's short stop turns it long. Only the stop of the side in force is drawn: green below price while long, red above price while short.
How to read Chandelier Exit
The green line is where a long position would be closed and the red line where a short one would be. A Buy mark is the bar the side turned long and a Sell mark the bar it turned short, so the marks alternate.
The stop follows the extreme, not the close, so it rises as new highs are made in an uptrend but can also slip lower when the average true range expands. A larger multiplier keeps the stop further from price and gives fewer, later turns; in a sideways market any setting turns often.
Settings
- ATR Period
- Bars in the average true range and in the window for the highest high and lowest low.
- ATR Multiplier
- How many average true ranges each stop hangs from the extreme. Larger values give wider stops and fewer turns.
- Show Buy/Sell Marks
- Mark the bars where the side turns long or short.
Frequently asked questions
Why does the line jump from below price to above it?
When the close crosses the stop of the side in force, the study switches sides and draws the other stop, which sits on the far side of price.
Is the close compared with this bar's stop or the previous one?
With the previous bar's stop, the level that was in force when the bar opened. This bar's stop already includes this bar's own high or low.
Which alerts does it offer?
One when the side turns long and one when it turns short, on the bar of the turn.