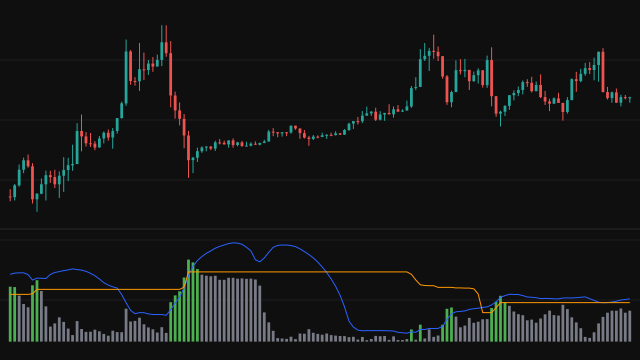
The Gopalakrishnan Range Index, from Jayanthi Gopalakrishnan, measures how much ground price covers in a window. It takes the highest high and the lowest low of the last 5 bars, finds the natural logarithm of the distance between them, and divides it by the natural logarithm of the window length:
GAPO = ln(highest high - lowest low) / ln(length)
The logarithm compresses large ranges, so the reading moves in small steps even when the range doubles. Dividing by the logarithm of the length puts windows of different lengths on a comparable scale. A window whose highest high equals its lowest low has no range and no logarithm, so it gives no value. The reading is drawn as a line in its own pane.
How to read Gopalakrishnan Range Index (GAPO)
A rising line means the recent range is widening, a sign of an erratic or trending market where price is covering ground; a falling line means the range is shrinking, a quiet or consolidating market. Traders use a low and flat reading to spot congestion that may precede a breakout, and a sharp rise to confirm that a move has energy.
The level depends on the price of the instrument, since the range is in price units, so compare the line with its own history rather than across symbols. It says nothing about direction: a range can widen in a rally or in a sell-off.
Settings
- Length
- Bars in the window whose full range is measured. 5 is the usual value; it must be at least 2, since the logarithm of 1 is zero.
Frequently asked questions
Why is there a logarithm in the formula?
It compresses the range so the reading changes smoothly, and dividing by the logarithm of the length lets windows of different lengths be compared on one scale.
Can I compare readings between two symbols?
Not directly. The range is measured in price, so a higher priced instrument reads higher. Compare each symbol with its own recent readings.
Does it show trend direction?
No. It measures only how wide the range is. Use it alongside a directional tool to tell a widening rally from a widening decline.