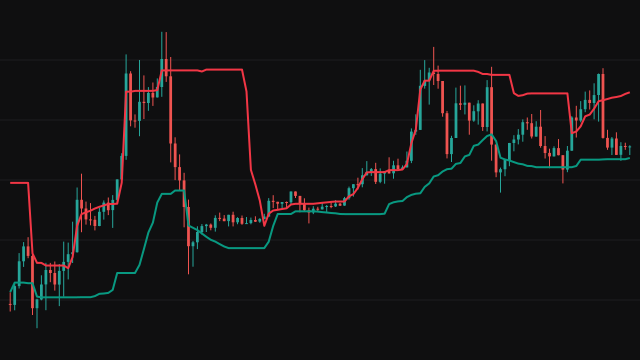
The Wilder Volatility Stop follows J. Welles Wilder's volatility system, a stop and reverse method that is always either long or short. Wilder's average true range over 7 bars is multiplied by a constant, 3 by default, to give the average range constant, ARC. The significant close, SIC, is the highest close since a long trade began or the lowest close since a short trade began.
While long the stop sits ARC below the significant close, and while short it sits ARC above it, so it moves only as far as the best close of the trade and widens or narrows with volatility. When a bar closes beyond the previous bar's stop, the position reverses, the significant close restarts at that close, and the stop jumps to the other side of price. The method does not fix the first position, so the study starts long on the first bar with an average true range.
How to read Wilder Volatility Stop
The green line below price is the stop of a long position and the red line above price the stop of a short one. A Long or Short label marks the bar whose close crossed the stop and reversed the position. While the trend holds, the stop trails it at a distance that adapts to how much the market is moving: wider in volatile stretches, tighter in quiet ones.
The stop reacts to closes only, so an intrabar spike through it does not reverse the position. Because the method is always in the market, a sideways market produces a run of small losing reversals. A larger constant gives fewer, later reversals; a smaller one gives more, earlier ones.
Settings
- ATR Length
- Bars in Wilder's average true range. 7 is the published value.
- ARC Constant
- How many average true ranges the stop keeps from the significant close. 3 by default; values from 2.8 to 3.1 are the usual range.
- Show Reversals
- Mark each bar where the close crossed the stop and the position reversed.
Frequently asked questions
What is the significant close?
The most favourable close of the current trade: the highest close since a long position began, or the lowest close since a short one began. The stop is measured from it, not from the latest bar.
Why does the stop sometimes move against the trade?
The distance is the constant times the latest average true range. If volatility rises while the significant close stays put, the stop moves further away; if volatility falls, it moves closer.
Why does the first position start long?
The method needs a position to begin with and does not say which. The study starts long on the first bar with an average true range. Only the first stretch of the chart depends on that choice: once price has made a decisive move, both starting positions end up on the same side.