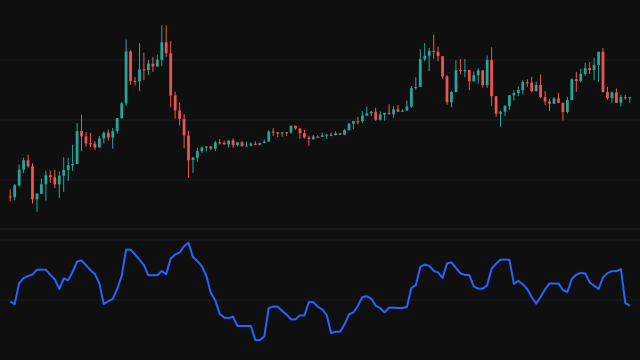
The Williams VIX Fix, from Larry Williams, estimates fear from price alone, with no options data. On each bar it takes the highest close of the last 22 bars and measures how far the bar's low sits below it, as a percentage of that close: WVF = 100 * (highest close - low) / highest close. When price falls hard from a recent high the reading jumps; in a steady advance it stays near zero.
Williams defined the reading itself. The two thresholds that decide when a reading counts as a spike are a widely used later addition, not part of his formula. The Upper Band is a Bollinger style band on the reading itself: its 20 bar simple average plus 2 population standard deviations. The Range High is the highest reading of the last 50 bars times 0.85, so a reading close to the recent extreme also qualifies.
The histogram is green on bars where the reading is at or above either threshold and gray otherwise. The two threshold lines can be hidden with the last setting.
How to read Williams VIX Fix
Tall green bars mark sell-offs that stretched well below the recent highest close, the kind of washout that often comes near a short-term low. Many traders use a run of green bars, followed by the first gray bar, as a cue to look for a long entry with their own trigger, since the spike says fear was high, not that it has finished.
The study only looks down from the highs, so it says little at market tops, and in a long decline it can stay green for many bars. The thresholds adapt to the instrument's recent behaviour, so a green bar on a quiet market is a smaller move than one on a volatile market.
Settings
- Lookback Length
- Bars over which the highest close is taken. 22 is the usual value, about a month of daily bars.
- Band Length
- Bars in the simple average and the standard deviation behind the upper band.
- Band Deviations
- Standard deviations added to the average for the upper band. Higher values mark fewer, larger spikes.
- Range Lookback
- Bars over which the highest reading is taken for the range high.
- Range High Factor
- The range high is the highest reading of the lookback times this factor. Lower values mark more bars green.
- Show Band and Range Lines
- Draw the upper band and the range high as lines. The histogram colour uses them either way.
Frequently asked questions
Does it need volatility index data?
No. It is built from the instrument's own closes and lows, so it works on any symbol and any timeframe, including ones that have no volatility index.
Why does it only turn green during sell-offs?
The reading measures the distance of the low below the recent highest close, so it grows only when price falls from a high. Rallies keep it low.
Is a green bar a buy signal?
It marks a spike in downside volatility, which often comes near a short-term low, but price can keep falling while the bars stay green. Most traders wait for the spike to fade and confirm with price.