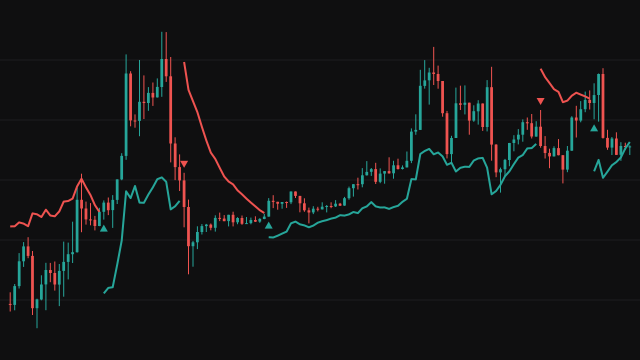
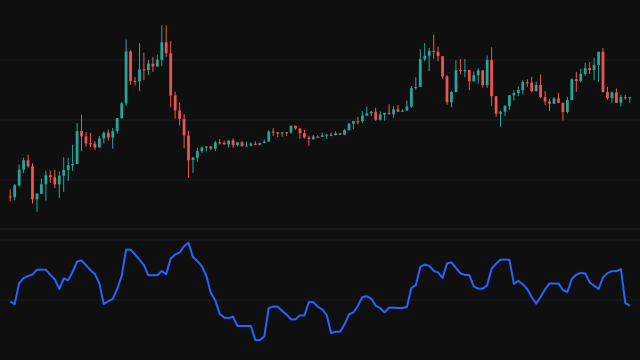
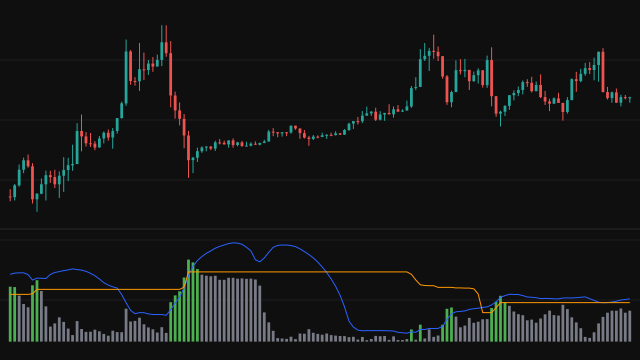
The Chande Kroll Stop, described by Tushar Chande and Stanley Kroll, places stops from the recent price extremes and the average true range. It works in two steps. First, over the last ATR Length bars (10 by default) it takes the highest high less ATR Multiplier average true ranges (the first high stop) and the lowest low plus the same distance (the first low stop). The average true range is Wilder's running average over the same number of bars.
Second, it smooths those first stops by holding their extremes: Stop Short is the highest first high stop over the last Stop Length bars (9 by default), and Stop Long is the lowest first low stop over the same window. Holding the extreme keeps each line from moving back on every bar, so both lines step rather than wiggle.
How to read Chande Kroll Stop
Read the close against both lines. A close above both of them points to an upward bias and a close below both to a downward one; while the close sits between them the market has no clear direction. Traders who use the lines as stops trail a long position with the lower of the two when price is above both, and a short position with the upper of the two when price is below both, exiting on a close through it.
A larger ATR Multiplier pulls the first stops further inside the extremes, which brings the two lines toward each other and can cross them. The lines follow volatility, so they widen after large bars and tighten in quiet periods, and in a choppy market price crosses them often.
Settings
- ATR Length
- Bars in the highest high, the lowest low and the average true range behind the first stops.
- ATR Multiplier
- How many average true ranges the first stops sit inside the highest high and the lowest low.
- Stop Length
- Bars over which the highest first high stop and the lowest first low stop are held. Longer gives steadier lines.
Frequently asked questions
Why is Stop Short built from the highs?
That is how the two lines are defined: Stop Short comes from the highest high less a range and Stop Long from the lowest low plus a range. Read together, a close above both lines leans up and a close below both leans down.
Which average true range does it use?
Wilder's running average of the true range over ATR Length bars, seeded with the simple average of the first ATR Length true ranges.
Why do the lines move in steps?
Each line is the extreme of the first stops over Stop Length bars, so it holds a value until a more extreme first stop arrives or the old one leaves the window.