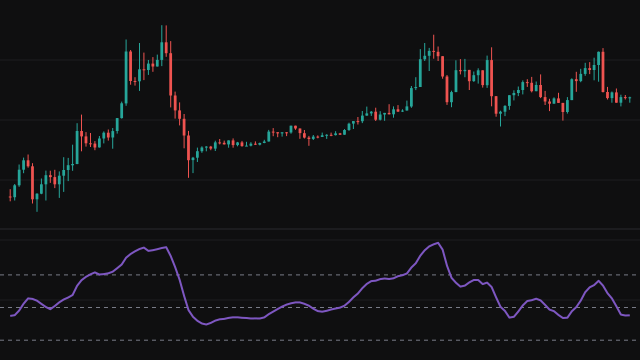
The Double Smoothed Stochastic is Walter Bressert's answer to the jumpy raw stochastic. The first pass finds where the close sits inside the highest high and lowest low of the last Stochastic Length bars, from 0 at the low to 100 at the high, and smooths that reading with an exponential average of EMA Length bars.
The second pass applies the same test to the smoothed line itself: where it sits inside its own highest and lowest values over the same window, again from 0 to 100, smoothed once more by an exponential average of the same length. The result is the single DSS line. Each exponential average starts from the simple average of its first values, and a window with no range at all reads as the midpoint, 50.
How to read Double Smoothed Stochastic (DSS)
Readings above 80 put the close near the top of its recent range and readings below 20 near the bottom. Because the line is smoothed twice it turns less often than a plain stochastic, so a turn down from above 80 or up from below 20 is the usual timing signal, read in the direction of the larger trend.
The line can stay pinned near 100 or 0 through a strong trend, so an extreme reading on its own is not a reversal. The two smoothing passes also add lag: the line turns a few bars after price does.
Settings
- Stochastic Length
- Bars in the high to low window of both stochastic passes. Longer windows give a slower line that reaches the extremes less often.
- EMA Length
- Bars in each of the two exponential averages. Longer values give a smoother line with more lag.
Frequently asked questions
How is it different from the ordinary stochastic?
The ordinary stochastic measures the close against the price range once. This one smooths that reading, measures the smoothed line against its own range, and smooths again, so it swings fully between 0 and 100 while turning far less often.
Why does the line start later than other oscillators?
Each of the four steps needs its own window to fill: the price window, the first average, the second window and the second average. With the defaults the first value appears on the 39th bar.
Is there a signal line?
No. The study draws the DSS line alone, with reference levels at 80 and 20; turns of the line at those levels are the signals.