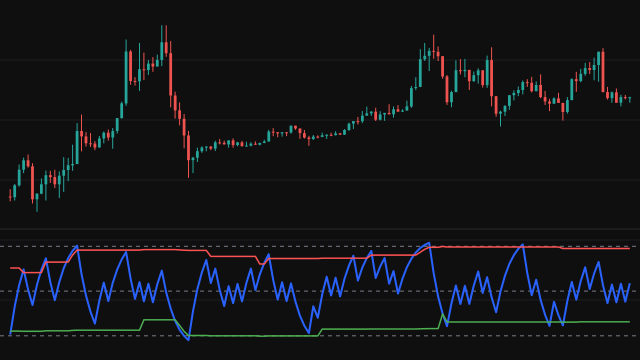
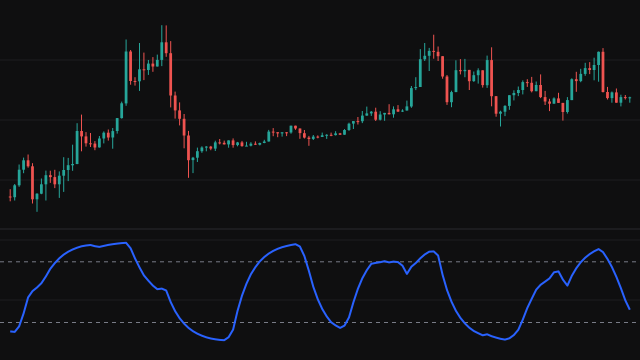
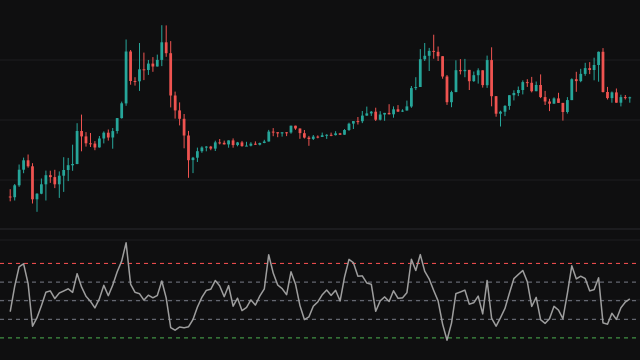
The Projection Oscillator, described by Mel Widner alongside his Projection Bands, turns the bands into a single reading. Over the last Length bars (14 by default) a least squares line is fitted through the highs and another through the lows. Every high in the window is carried forward to the current bar along the slope of the highs and every low along the slope of the lows; the upper band is the largest carried high and the lower band the smallest carried low.
The oscillator is 100 * (close - lower) / (upper - lower): 0 when the close is on the lower band, 100 when it is on the upper band and 50 halfway between. Because the bands tilt with the trend, the reading measures the close against where the market's recent extremes would be along that trend, not against a flat range. A trigger line, an exponential average of the oscillator over Trigger Length bars (3 by default), smooths it.
How to read Projection Oscillator
Readings near 100 mean the close is pressing on the upper band and near 0 that it sits on the lower band; the dashed lines at 80 and 20 mark those zones. A turn of the oscillator through its trigger line is the usual signal: crossing up from a low reading suggests the close is lifting off the lower band, crossing down from a high reading that it is falling away from the upper band.
In a strong trend the oscillator can stay near one extreme for many bars, so a high reading alone is not a reason to sell. The short trigger line makes crossings frequent in a choppy market; a longer Trigger Length gives fewer, later crossings.
Settings
- Length
- Bars in the window the regression slopes and the carried highs and lows are taken from. Longer gives a slower oscillator.
- Trigger Length
- Bars in the exponential average of the oscillator drawn as the trigger line.
Frequently asked questions
Can the oscillator go above 100 or below 0?
No. The upper band is at least the current high and the lower band at most the current low, so the close always lies between them and the reading stays within 0 to 100.
How does it differ from a stochastic oscillator?
A stochastic compares the close with the plain highest high and lowest low of the window. Here each high and low is first shifted along the trend's slope, so in a trending market the reading is measured against tilted bands rather than a flat range.
Why is it blank on the first bars?
The bands need Length bars for their slopes, so the oscillator first appears on the Lengthth bar. The trigger then waits until it has Trigger Length oscillator values, so it starts Trigger Length - 1 bars later.