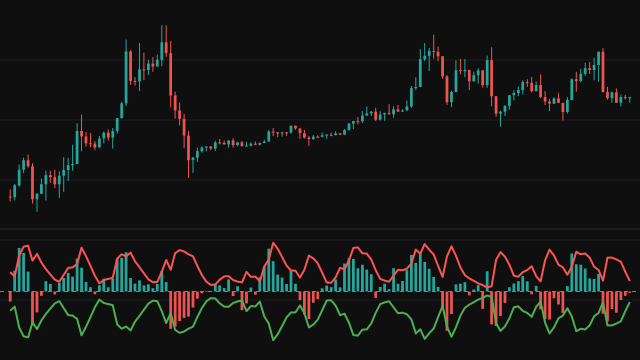
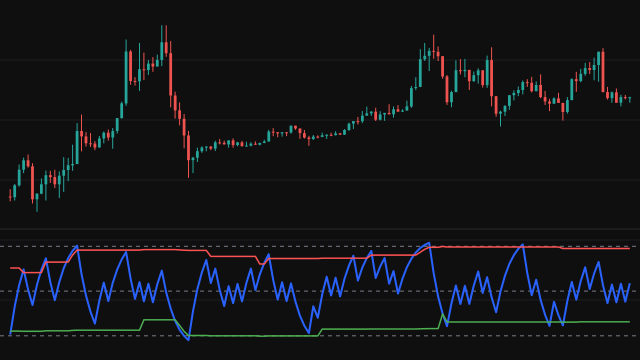
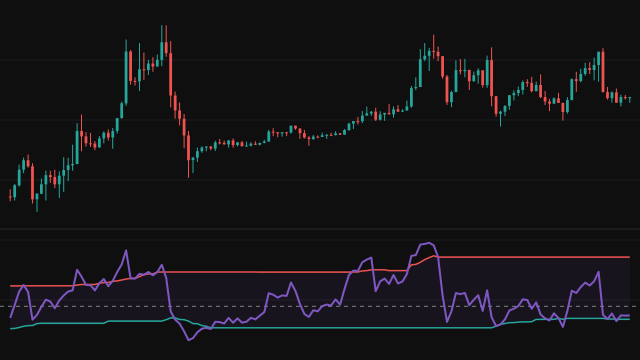
The Value Chart, from Mark Helweg and David Stendahl, redraws every bar relative to recent prices, so it shows whether a bar is cheap or expensive rather than where it traded. It builds a floating axis, the simple average of the bar midpoint (high plus low, halved) over the last Length bars, 5 by default, and a volatility unit, one fifth of the average range of the last five blocks of bars. A block is Length / 5 bars, rounded and at least one, and its range is its highest high less its lowest low. At the default length a block is a single bar, so the unit is one fifth of the average high to low range of the last 5 bars. A single bar with no range at all counts its move from the previous close instead.
Each of the bar's open, high, low and close is then restated as its distance from the axis divided by the unit, and the four values are drawn as a candle in their own pane. A value of +8 means the price sat eight volatility units above the axis. Dashed lines mark +8 and -8, the overbought and oversold extremes, and +4 and -4, the edges of the fair value zone, with the axis at zero.
How to read Value Chart
Candles inside the band from -4 to +4 are trading near fair value relative to the last few bars. Highs that reach +8 or more are stretched to the upside and lows at -8 or below to the downside, which traders read as places where a bounce or a pullback is more likely and where chasing the move is costly.
Because the axis and the unit are only a few bars long, the scale resets quickly: a strong trend keeps dragging the axis with it, so the chart flags short term extremes rather than the trend itself. A single wide bar can also enlarge the unit and shrink the next few candles.
Settings
- Length
- Bars in the floating axis. The volatility unit always averages five blocks of about a fifth of this many bars, so the scale stays comparable at any length. 5 is the usual value; a longer length makes the axis steadier.
Frequently asked questions
What does a value of +8 mean?
The price was eight volatility units above the floating axis, where a unit is a fifth of the recent average block range (at the default length, of the average bar range). It is the conventional overbought extreme.
Why is it drawn as candles?
All four prices of the bar are restated, so the candle shows where the bar opened, ranged and closed relative to value, not only one line.
Can I compare readings across instruments?
Yes. Every value is in units of that instrument's own recent range, so +8 is equally stretched on any instrument and timeframe.