Dynamic zones were described by Leo Zamansky and David Stendahl as a replacement for the fixed 70 and 30 lines on an oscillator. A fixed line means something different on every instrument and in every market phase: in a strong uptrend the RSI can stay above 70 for weeks, and in a quiet range it may never reach it.
This study computes Wilder's 9 bar RSI, the length used in the inventors' own example, and then looks at its last 70 readings. The overbought zone is found by counting down from the highest of those readings until 10 percent of the window is covered: with 70 readings that is the 7th highest, so 10 percent of the window sits at or above it. The oversold zone is the same counted up from the lowest reading. Each zone is always one of the RSI's own readings, never a value between two of them. Because the window moves with every bar, the zones rise in a strong market and fall in a weak one.
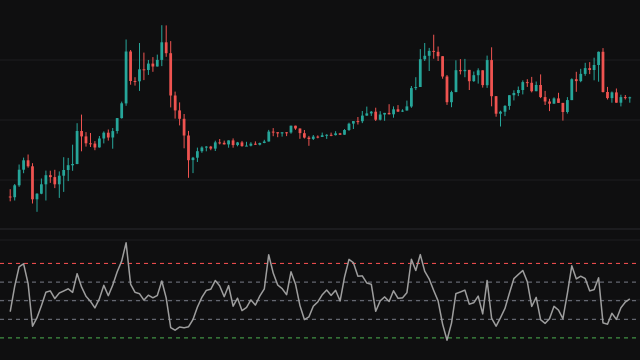
The RSI is drawn as a purple line between the two zones, which are shaded, with a dashed line at 50.
How to read Dynamic Zone RSI
An RSI above the overbought zone is high compared with its own recent history, not compared with a fixed number; below the oversold zone it is unusually low. Many traders read a return from beyond a zone back inside it as the signal, rather than the first touch. When both zones drift upward the market has been strong for a while, and when they drift down it has been weak.
The zones describe the recent past, so a new kind of move can push the RSI through a zone and keep it there until the window catches up.
Settings
- Source
- The price series the RSI is computed from. Close is the usual choice.
- RSI Length
- Bars in Wilder's averages of gains and losses. The default of 9 follows the inventors' example; 14 is the other common choice. Shorter values make the RSI swing further and faster.
- Zone Lookback
- How many past RSI readings the zones are measured over. A longer lookback gives steadier zones that adapt more slowly.
- Overbought Probability %
- The share of past readings at or above the overbought zone. Smaller values push the zone higher and make it harder to reach; 0 puts it at the highest reading in the window.
- Oversold Probability %
- The share of past readings at or below the oversold zone. Smaller values push the zone lower and make it harder to reach; 0 puts it at the lowest reading in the window.
Frequently asked questions
Why not just use 70 and 30?
Fixed lines ignore how the RSI has actually behaved on this instrument lately. Dynamic zones are set from its own readings, so an extreme always means extreme for the recent past.
What does a probability of 10 percent mean here?
Over the lookback, one reading in ten was at or above the overbought zone and one in ten at or below the oversold zone. A reading beyond a zone is therefore in the top or bottom tenth of recent history. When the share does not come out to a whole number of readings, it is rounded up, so the zone covers at least that share.
Why do the zones appear later than the RSI?
The zones need a full window of RSI readings, so they start once the RSI has run for the whole lookback.