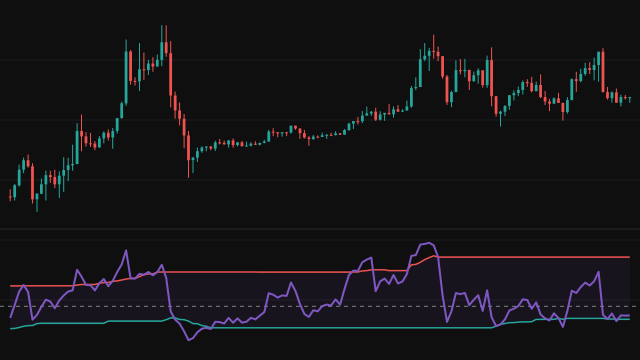
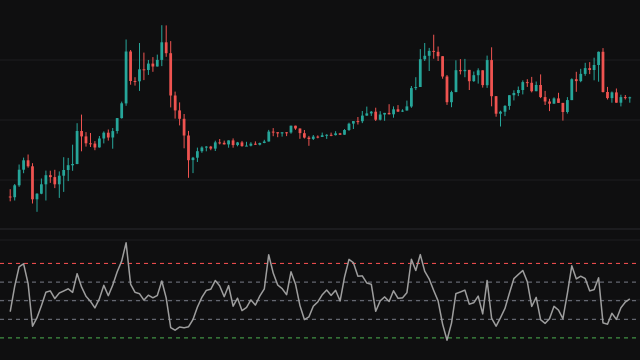
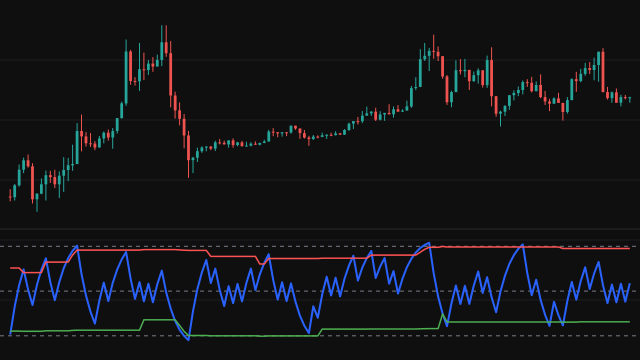
The Rainbow Oscillator was described by Mel Widner. It starts from ten simple averages stacked on top of each other: the first is a 2 bar average of the close, the second is a 2 bar average of the first, and so on up to the tenth. Each layer is smoother and later than the one below it, which is where the rainbow name comes from when the ten are drawn on price.
The oscillator is the distance between the close and the mean of the ten layers, scaled by the range of the close over the last 10 bars and multiplied by 100. The band is the distance between the highest and the lowest of the ten layers on the same scale: the upper band is that spread and the lower band is its negative.
The oscillator is drawn as a histogram around zero, green above and red below, with the two bands as lines. A bar whose close did not move at all over the lookback has no range to scale by and shows nothing.
How to read Rainbow Oscillator
Above zero, price is above the centre of its own smoothed layers, a sign of upward pressure; below zero, the reverse. The bands widen when the layers fan out, which happens in a steady trend, and narrow when they bunch together in a quiet market. A histogram that pushes outside the bands marks a move that is stretched compared with how spread out the averages are, and a histogram shrinking back toward zero while the bands stay wide often comes before a pause.
The reading is scaled by a short range, so on a very quiet stretch small moves look large. Read it with the price chart, not alone.
Settings
- Source
- The price series the ten averages, the oscillator and the range are taken from. Close is the usual choice.
- Average Length
- Bars in each of the ten stacked simple averages. Longer values make every layer smoother and spread the band wider.
- High Low Lookback
- Bars over which the highest and lowest source set the scale. A longer lookback gives smaller, steadier readings.
Frequently asked questions
Why ten averages?
That is how the indicator is defined. Each extra layer is a little later than the last, and the spread across all ten shows whether the market has been trending or going sideways.
What does it mean when the histogram is outside the bands?
Price has moved further from the centre of its layers than the layers are spread apart. It marks a stretched move; it does not on its own say the move is over.
Why is the lower band a mirror of the upper one?
Both come from the same spread between the highest and lowest layer. The lower band is drawn as its negative so the oscillator can be compared with it on either side of zero.