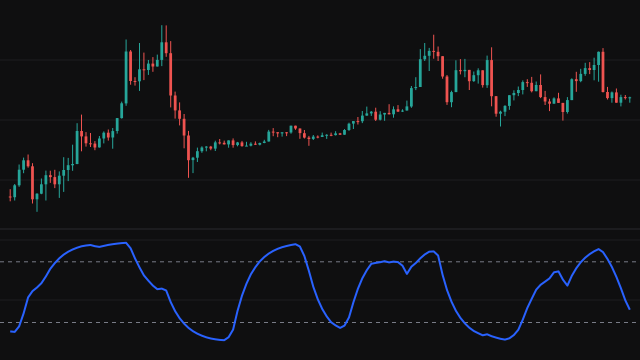
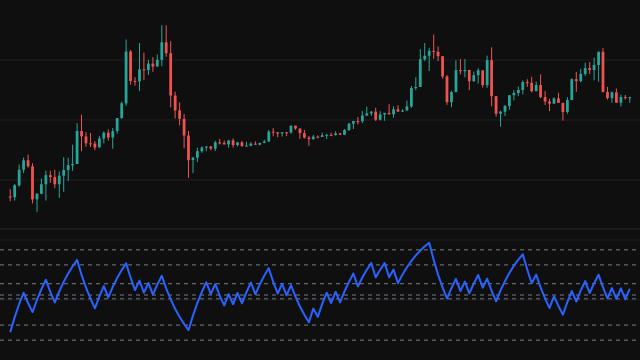
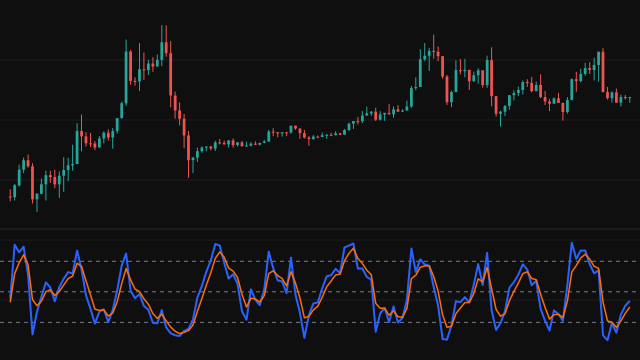
The Relative Momentum Index, designed by Roger Altman, extends the relative strength index. Instead of comparing each close with the one before it, it compares the source with its value a number of bars back, the momentum setting (5 by default).
Each bar's change over that span is split into a rise (the change when positive, else zero) and a fall (the size of the change when negative, else zero). Both are smoothed with Wilder's average over the length (20 bars by default, the setting its author used alongside a momentum of 5), which starts from the simple average of the first values. The index is 100 - 100 / (1 + average rise / average fall), and 100 when the average fall is zero.
With a momentum of 1 the study is the ordinary relative strength index.
How to read Relative Momentum Index (RMI)
Values above 70 mark an overbought market and values below 30 an oversold one; the 50 line divides upward from downward momentum. Because the change is taken over several bars, the index swings more smoothly and stays near its extremes longer than the ordinary relative strength index, which suits it to trending markets: a pullback that holds above 50 in an uptrend is a sign the trend is intact.
A reading can stay overbought or oversold for a long time in a strong trend, so the levels are not sell or buy signals on their own. A larger momentum setting smooths the line further but also delays it.
Settings
- Source
- The price series the change is taken from. Close is the default.
- Length
- Bars in Wilder's average of the rises and falls. 20 is the published default; a larger value gives a smoother, slower line.
- Momentum
- How many bars back the change is measured. 1 gives the ordinary relative strength index; larger values smooth the swings.
Frequently asked questions
How is it different from the relative strength index?
The relative strength index uses the one-bar change. This index uses the change over several bars, 5 by default, so it reacts to a sustained move rather than to each bar's noise.
Which levels should I use?
70 and 30 are the usual overbought and oversold levels, with 50 as the midline. Some traders widen them to 80 and 20 because the index reaches its extremes more easily than the relative strength index.
When does it first show a value?
After the momentum span plus the length, 5 plus 20 bars at the defaults, since the change needs its earlier value and the averages need a full window.