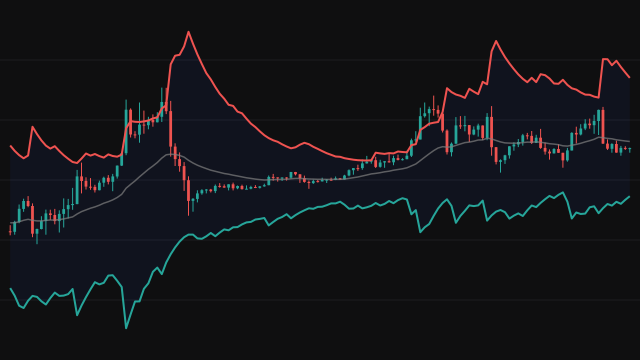
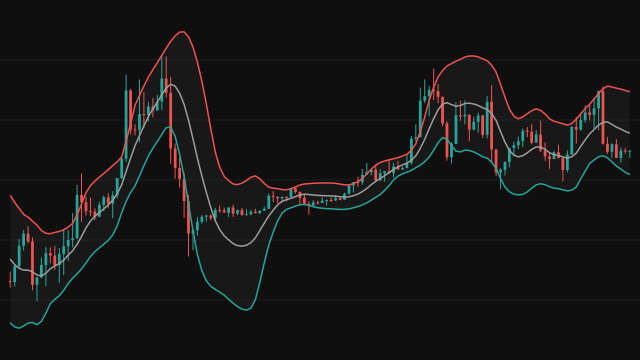
The AutoEnvelope, described by Alexander Elder, is a channel around an exponential average whose width sets itself from the market instead of from a fixed percentage. Elder sizes it to hold about 95 percent of the prices of recent months, with only the extremes poking out. The centre line is an exponential average of the source over Average Length bars (22 by default).
The width follows the most widely documented formula for it. On each bar the study takes the larger of two distances, the high's from the average and the low's from the average, and divides it by the average to get a fraction. The standard deviation of that fraction over the last Lookback bars (100 by default) is multiplied by Deviations (2.7 by default) and by the average to turn it back into price, and each envelope sits that far above and below the average.
The channel is symmetric around the average and starts once the average and the lookback are both covered. Some versions hold the width fixed for a week at a time; this study updates it on every bar, which changes little because the 100 bar window moves slowly.
How to read Elder AutoEnvelope
In an uptrend, buying near the average and taking profit near the upper envelope is the classic use; in a downtrend, the reverse with the lower envelope. Prices that reach an envelope are stretched relative to the last 100 bars, so a touch is more often a place to take profit than to chase. The slope of the average gives the trend.
The width adjusts slowly because the lookback is long. After a calm period the channel is narrow and a sudden expansion can run well outside it, and after a wild period it stays wide for a while. A close beyond an envelope for several bars means volatility has risen faster than the channel can adapt.
Settings
- Source
- The price series the exponential average is taken over. Close is the default.
- Average Length
- Bars in the exponential average at the centre of the channel. 22 is about a month of daily bars.
- Lookback
- Bars over which the spread of highs and lows around the average is measured. Longer lookbacks give a steadier width.
- Deviations
- How many standard deviations each envelope sits from the average. 2.7 is the usual setting and holds most prices; smaller values narrow the channel.
Frequently asked questions
How is this different from a fixed percentage envelope?
A fixed envelope needs its width chosen by hand for every instrument and has to be retuned when volatility changes. This one measures how far highs and lows have been reaching from the average and sets the width from that.
Why use the highs and lows rather than the closes?
The channel is meant to contain prices, and the highs and lows are the furthest prices reach. Measuring the larger of their distances from the average sizes the channel to the extremes, not just the closes.
Why is the default 2.7 and not 2?
The deviation is taken of the reach away from the average, which is always positive and varies less than price itself, so it takes a larger multiple to hold about 95 percent of prices. 2.7 is the setting commonly given for this channel.