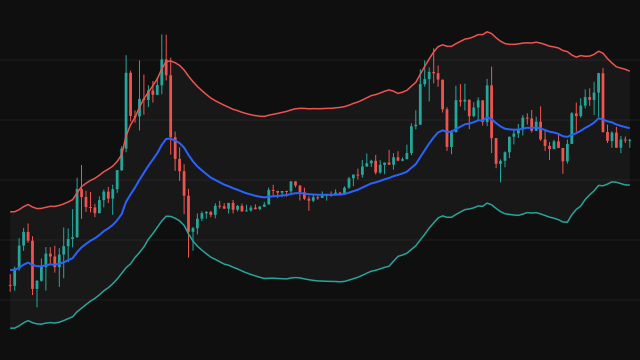
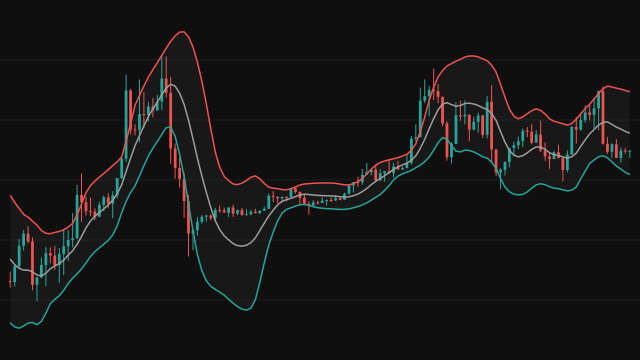
RSI Bands, described by Francois Bertrand, turn the relative strength index into prices. Instead of asking what RSI is now, they ask what price the next bar would have to close at for RSI to reach 70, or to fall to 30, and draw those prices as bands on the chart.
The study keeps Wilder's averages of up moves and down moves over RSI Length bars (14 by default), the same two averages RSI is built from. For a target level L the ratio of the averages must equal L / (100 - L) after the next bar. When RSI is below the level the next bar needs a gain, and the band is source + (length - 1) * (avgDown * L / (100 - L) - avgUp). When RSI is already above it the next bar needs a loss, and the band is source - (length - 1) * (avgUp * (100 - L) / L - avgDown).
The upper band uses the overbought level, the lower band the oversold level, and a thin middle band shows the price at which RSI would sit exactly at 50.
How to read RSI Bands
Each bar's band values are computed from that bar's averages and answer a question about the next bar: the upper band is the close the next bar needs for RSI to reach the overbought level, and the lower band the close it needs to reach the oversold level. So compare a bar's close with the bands drawn on the bar before it: a close at or above the previous bar's upper band puts RSI at or above 70, and a close at or below the previous bar's lower band puts it at or below 30. Read this way, the bands give an RSI signal a price before it happens, which is useful for placing orders at the level instead of waiting for the oscillator.
The bands are not symmetric around price: in a strong advance the upper band sits close above price and the lower band far below, and in a decline the reverse. A band that hugs price shows how little movement is needed to reach the extreme. They describe RSI, not support or resistance, so they say nothing about whether price will stop there.
Settings
- Source
- The price series RSI is computed on, and the price the bands are measured from. Close is the default.
- RSI Length
- Bars in Wilder's averages of up and down moves. 14 is the standard RSI length.
- Overbought Level
- The RSI level the upper band is drawn for. Raising it moves the band further from price.
- Oversold Level
- The RSI level the lower band is drawn for. Lowering it moves the band further from price.
Frequently asked questions
Why does a band sometimes sit on the other side of price?
When RSI is already above the overbought level, the upper band is the lower price at which RSI would fall back to that level, so it can sit below the close. The same holds for the lower band when RSI is below the oversold level.
Do the bands predict where price will go?
No. Each band is the close the next bar would need for RSI to reach a level. It translates an RSI threshold into a price; it does not say price will reach it.
Are the bands the same as Bollinger Bands?
No. Bollinger Bands are built from the standard deviation of price. RSI Bands come from the up and down averages behind RSI, so their width depends on the balance of gains and losses, not on volatility alone.