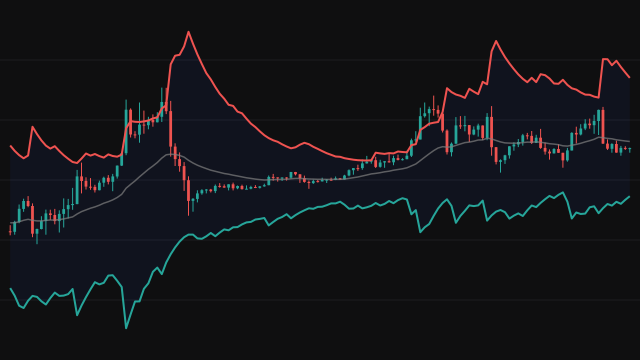
Standard Error Bands, described by Jon Andersen, wrap price around a linear regression rather than a moving average. On every bar a least squares line is fitted to the last Regression Length values of the source, and the value of that line on the current bar is the regression end value.
The width of the bands comes from the standard error of that regression: the square root of the summed squared distances of each value from the fitted line, divided by the length minus two. It measures how closely recent prices follow a straight line, not how far they have moved. A steady trend, even a steep one, fits the line well and gives a small standard error.
The end value and the standard error are each smoothed with a simple average over Smoothing bars. The middle line is the smoothed end value, and the upper and lower bands sit Standard Errors times the smoothed standard error above and below it.
How to read Standard Error Bands
Narrow bands mean prices are lining up along a straight path: a clean trend in whichever direction the middle line slopes. Widening bands mean prices are scattering around the line, which happens when a trend loses its shape, reverses or turns into choppy trading. The slope of the middle line gives the direction, the band width gives the quality of the move.
Unlike volatility bands, these bands do not have to widen in a fast trend, so a sharp move along a straight path keeps them tight. A close outside a band is a large departure from the recent straight-line path. The smoothing delays both lines by about a bar, and a short regression length makes the bands jumpy.
Settings
- Source
- The price series the regression is fitted to.
- Regression Length
- Bars in each least squares fit. Longer lengths give a smoother middle line and steadier bands; the minimum is 3.
- Smoothing
- Bars in the simple average applied to both the regression end value and the standard error. Set it to 1 for no smoothing.
- Standard Errors
- How many smoothed standard errors the bands sit from the middle line. Larger values give wider bands.
Frequently asked questions
How is this different from standard deviation bands around a moving average?
Those bands measure the spread of price around an average, so a strong trend widens them. These measure the spread around a fitted straight line, so a strong but orderly trend keeps them narrow.
Why does the standard error divide by length minus two?
Fitting the line uses up two values, its slope and its level, so the residuals have two fewer degrees of freedom than there are bars.
What does the middle line show?
The value of the least squares line on the current bar, averaged over the last few bars. It is a moving average with less lag than a simple average of the same length.