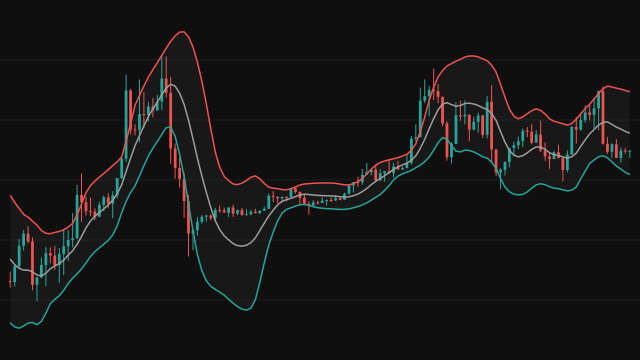
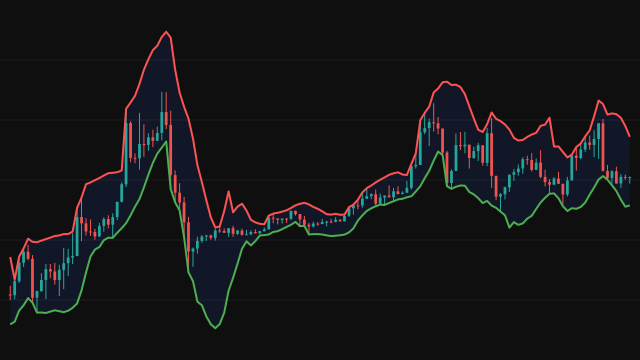
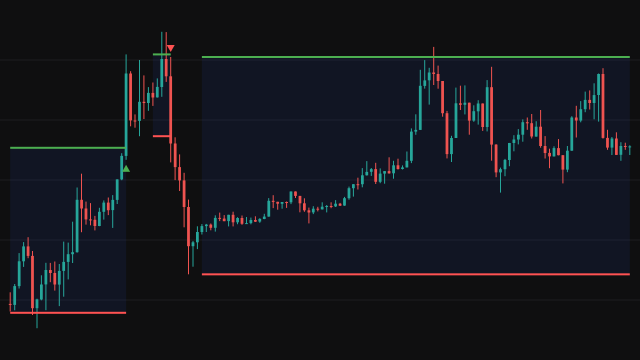
Tirone Levels, described by John Tirone, turn the range of recent trading into a set of reference prices. Over the last Length bars the study finds the highest high (HH) and the lowest low (LL); the distance between them is the range.
The Midpoint method draws three lines. The top line sits a third of the range below the highest high, the bottom line a third of the range above the lowest low, and the centre line halfway between the two extremes. The range is in effect divided into a top third, a middle third and a bottom third.
The Mean method draws five lines around an adjusted mean, the average of the highest high, the lowest low and the current close. The extreme high and extreme low are one full range above and below that mean. The regular high is twice the mean minus the lowest low and the regular low is twice the mean minus the highest high, which reflects each extreme through the mean. Because the close is part of the mean, these lines shift with each bar's close while the midpoint lines move only when the window's extremes change.
How to read Tirone Levels
With the midpoint method, price above the top line is trading in the upper third of the recent range and price below the bottom line in the lower third; the centre line is the balance point. Traders watch the top and bottom lines as areas where a move inside a range tends to stall, and a close beyond them as a sign the range is being left behind.
With the mean method, the regular high and low frame normal trading around the adjusted mean, and the extreme lines mark stretched prices that are seldom held for long. The levels describe the recent past only: a strong trend carries price through them, and a short length makes them move with nearly every bar.
Settings
- Length
- Bars in the window whose highest high and lowest low set the levels. A longer window gives wider, steadier levels.
- Method
- Midpoint draws the top, centre and bottom lines from the range alone. Mean draws five lines around the average of the extremes and the close.
Frequently asked questions
Why do the mean method lines move on bars where the range did not change?
The adjusted mean includes the current close, so every line built from it moves with the close. The midpoint lines depend only on the highest high and lowest low.
Is the centre line the same as a channel midline?
Yes. It is halfway between the highest high and the lowest low of the window, the same midline a price channel of the same length would draw.
Which method should I use?
The midpoint method suits reading where price sits within a range. The mean method adds wider extreme lines and reacts to the close, which suits judging how stretched the latest bar is.