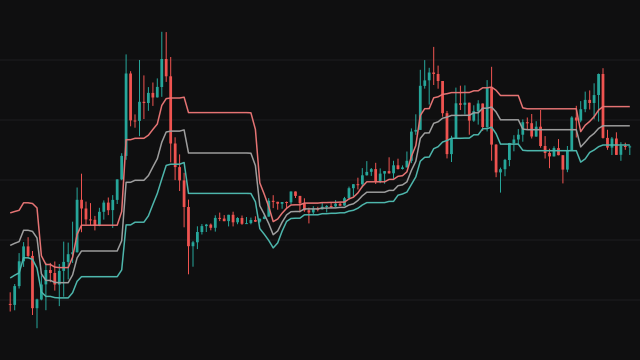
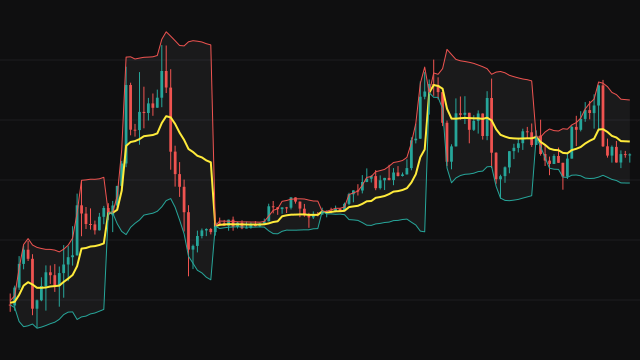
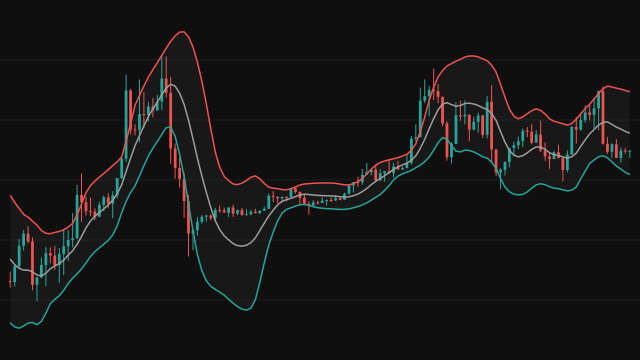
Projection Bands, described by Mel Widner, frame price with the extremes of where recent highs and lows would be today if each had moved along the current trend. Over the last Length bars (14 by default) a least squares line is fitted through the highs and another through the lows, and the slope of each line is taken as the trend per bar.
Every high in the window is then carried forward to the current bar: a high five bars back is raised by five times the slope of the highs (or lowered, when that slope is negative). The upper band is the largest of these carried highs. The lower band is built the same way from the lows and their slope, and is the smallest carried low. Because each band is anchored on a real price and only shifted by the trend, it hugs price closely and tilts with the market.
How to read Projection Bands
Price normally travels between the two bands. In a steady trend both bands slope with it, and a close pressing against the upper band in an uptrend (or the lower band in a downtrend) shows the move running at full strength. A close that pulls away from the band it was riding, or bands that flatten and narrow, warn that the trend is losing its slope.
The bands react to the slope of only the last Length bars, so a single sharp bar can tilt them, and in a sideways market they become a plain envelope of the recent range. They describe where price has been relative to its trend; they do not forecast a target.
Settings
- Length
- Bars in the window the regression slopes and the carried highs and lows are taken from. Longer gives smoother, wider bands; shorter follows price more closely.
Frequently asked questions
How is this different from a regression channel?
A regression channel draws the fitted line and offsets it by a fixed distance. Projection Bands keep the actual highs and lows and only shift each one by the trend, so the bands sit on real prices rather than on a line with a constant width.
Why do the bands sometimes jump?
When an extreme high or low leaves the window, a different bar becomes the largest carried high or smallest carried low, and the slope itself can change. Either can move a band by a visible step.
Is there an oscillator built on these bands?
Yes. The Projection Oscillator in this library shows where the close sits between the two bands as a percentage from 0 to 100.