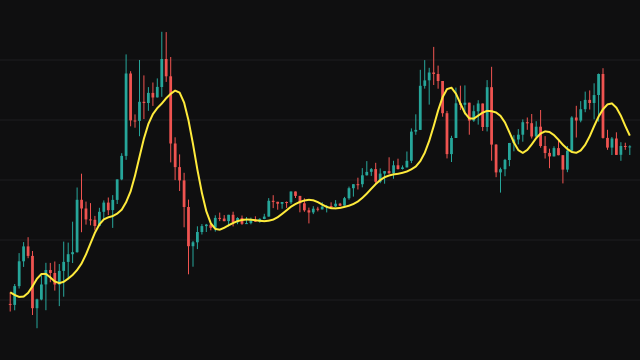
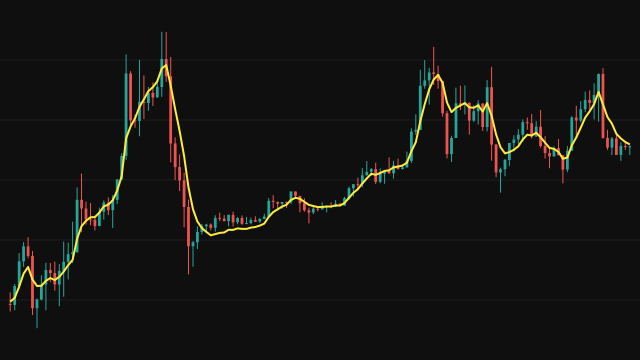
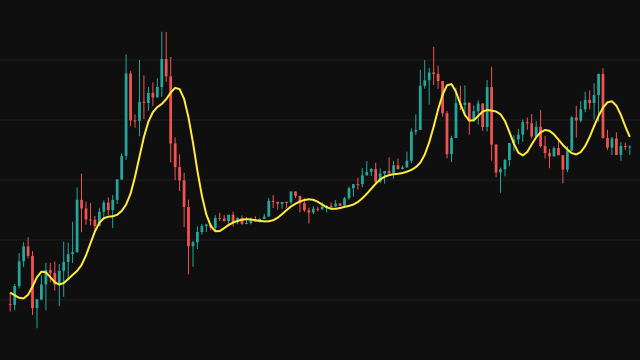
The Gaussian-Weighted Moving Average weights the bars of its window with a bell curve. The curve is centred on the middle of the window, so the bars near the centre carry the most weight and the newest and oldest bars the least. The width of the bell is the Sigma setting multiplied by the window length, and the weights are scaled to sum to one before the weighted prices are added up.
The window grows with the chart until it holds period bars, and the bell is rebuilt for each length, so the line is drawn from the first bar. A missing price is skipped along with its weight. The taper at both ends softens the step a flat average shows when a large bar enters or leaves the window.
How to read Gaussian-Weighted Moving Average (GWMA)
Read the GWMA as a smooth trend line. Because its weight is centred on the middle of the window, it lags more than an average that favours the newest bar, roughly half a window behind price, but its path is very even. Use it to judge the direction and slope of the trend rather than to time turns.
A smaller Sigma narrows the bell, concentrating weight on fewer central bars; a larger Sigma spreads it toward an equal weighting. In either case the line trails sharp moves, so price crossing it is a late signal.
Settings
- Period
- Number of bars in the full window. A longer period gives a smoother, slower line.
- Sigma
- Width of the bell as a fraction of the window. Lower values narrow it around the centre; higher values flatten it toward equal weights.
- Source
- The price series the average is taken from, the close by default.
Frequently asked questions
Why does the GWMA lag more than an exponential average?
Its weights peak at the centre of the window, not at the newest bar, so the line describes where price was about half a window ago.
What does Sigma change?
The spread of the bell curve. At 0.1 nearly all the weight sits on the central bars; at 1 the curve is broad and the weights are close to equal.
Why does the line start on the first bar?
The window grows with the chart until it holds the full period, and the bell weights are rebuilt for each length, so every bar has a value.