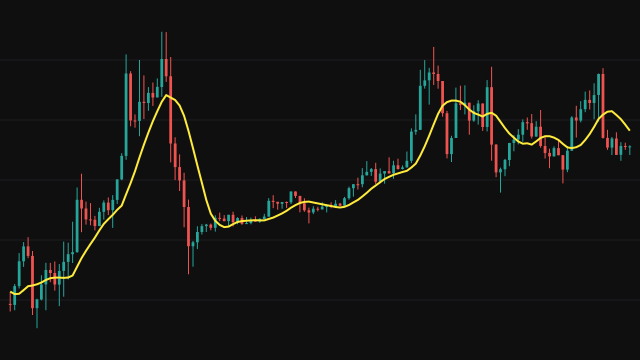
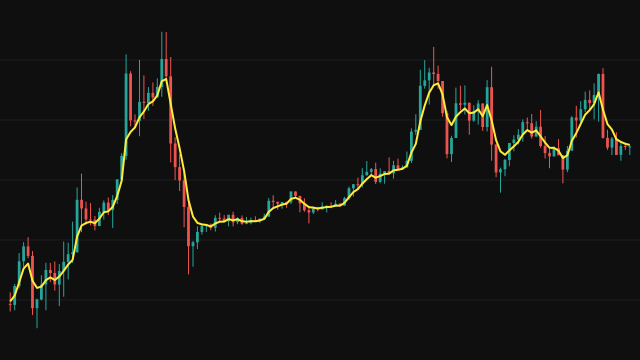
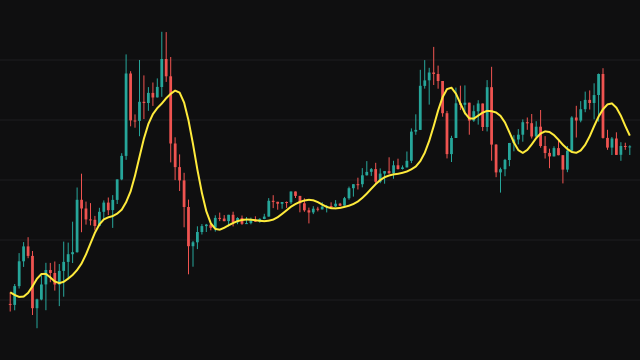
GDEMA builds on two exponential averages. The first smooths the source with the weight 2 / (period + 1). The second smooths the first with the same weight, so it lags further behind price. The gap between them measures how much lag the smoothing added, and the study subtracts a share of that gap: the line is (1 + v) * EMA1 - v * EMA2.
The factor v sets how much lag is taken out. At 0 the line is the first average alone, at 1 it is the classic double exponential average, and above 1 it removes more lag than the smoothing put in, so the line leads turns and overshoots them.
Both averages start from zero, and on the early bars each is divided by 1 - beta^n, where beta is one minus the weight and n the number of bars seen. That removes the pull toward zero, so the line follows price from the first bar instead of waiting for a warmup.
How to read Generalized Double Exponential Moving Average (GDEMA)
Read GDEMA like any moving average: price above a rising line is an uptrend, price below a falling line a downtrend, and a cross of price through the line is an early hint that the move is changing. Compared with an exponential average of the same period it turns sooner, because part of its lag has been taken out.
The price of a faster turn is overshoot. With a high v the line runs past price at the end of a sharp move and then snaps back, which can look like a false signal. Keep v near 1 for a balanced line and lower it on choppy charts.
Settings
- Period
- Length of both exponential averages. A longer period gives a smoother, slower line.
- Volume Factor (v)
- How much of the lag is subtracted: 0 is a plain exponential average, 1 the standard double exponential average, and higher values lead price more and overshoot more.
- Source
- The price series the average follows. Close is the usual choice; hl2 or another blend smooths out closes that jump around.
Frequently asked questions
Does the Volume Factor use traded volume?
No. The name only describes how much of the lag correction is applied. The calculation reads the source price alone and never touches volume.
Why does the line start on the very first bar?
Both averages start from zero and are scaled up by 1 / (1 - beta^n) while they are young, which removes the bias toward zero. Once that correction is negligible it is switched off and the averages run unscaled.
What does a v above 1 do?
It subtracts more lag than the smoothing added, so the line leads price through a turn. That makes it faster but also makes it overshoot after sharp moves.