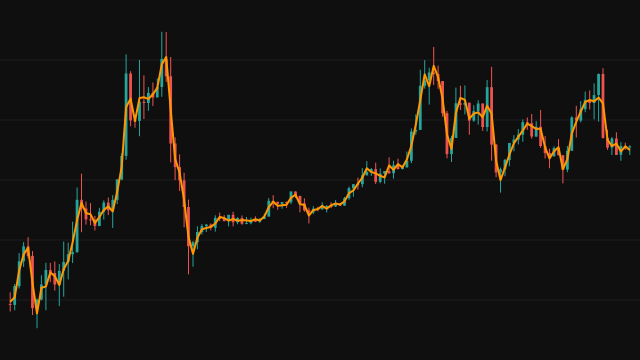
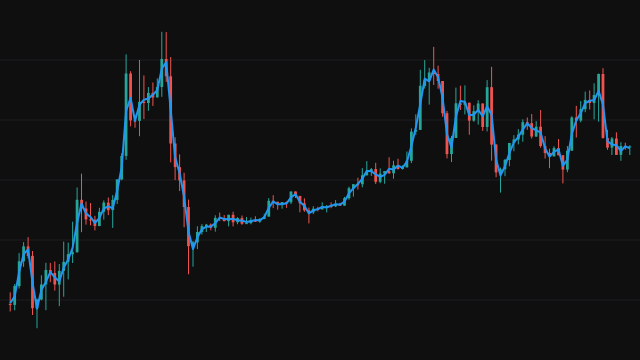
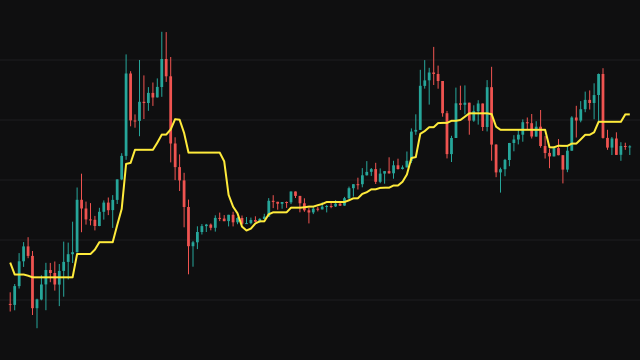
Heikin-Ashi redraws every bar as a synthetic candle. Its close is the average of the bar's open, high, low and close. Its open is the midpoint of the previous synthetic candle's open and close; on the first bar, where there is no previous candle, it is the midpoint of the bar's own open and close.
The high of the synthetic candle is the highest of the bar's high, the synthetic open and the synthetic close, and the low is the lowest of the three. Each candle is drawn green when its synthetic close is at or above its synthetic open and red otherwise, with body, border and wick in the same colour. Because each open carries half of the previous candle, the series is smoothed without being shifted in time.
How to read HA: Heikin-Ashi
Runs of green candles with little or no lower wick show a steady advance, and runs of red candles with little or no upper wick show a steady decline. Small bodies with wicks on both sides, or a change of colour, show the move losing pace.
The synthetic prices are not prices that traded: the open and close of a smoothed candle usually differ from the real open and close of the bar. Use the candles to read the trend, and read entries, stops and fills from the real bars underneath.
Frequently asked questions
Why do the candles differ from the real bars?
Each synthetic close is the bar's average price and each synthetic open carries half of the previous candle, so the values are smoothed versions of the bar, not prices that printed.
Why are there fewer colour changes than on the real chart?
The open of each candle is tied to the previous one, so a single bar against the trend rarely flips the colour. That is the smoothing doing its job.
Is it shifted in time?
No. Every candle uses only its own bar and the previous synthetic candle, so it sits on the same bar as the price it describes. The smoothing does mean a turn in price can take a bar or more to change the candle colour.