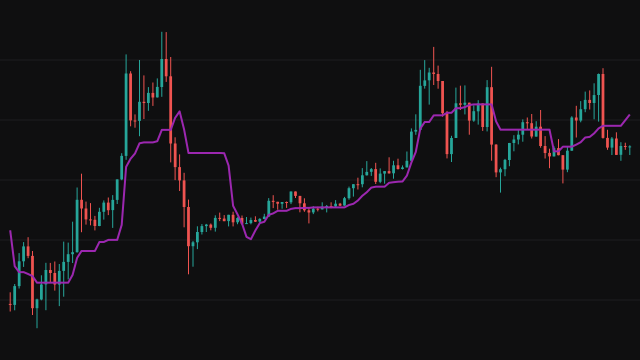
Midpoint finds the highest and the lowest value of one source series, the close by default, over the last length bars, and draws the point halfway between them. It describes the centre of the range the source has covered recently, not an average of every value in the window.
Because only the two extremes matter, the line holds flat for as long as no new high or low enters or leaves the window, then steps when one does. The line is absent until the window has filled, so the first length - 1 bars carry no value.
How to read Midpoint (MIDPOINT)
Price above the midpoint is trading in the upper half of its recent range, and price below it in the lower half. A rising midpoint shows the range itself moving up, which happens only when new highs are set or old lows drop out of the window.
The flat stretches are a feature of the calculation, not a sign that nothing is happening. Pair it with the range itself or with a trend study, since the midpoint alone says where the centre is, not how wide the range is.
Settings
- Source
- The series whose highest and lowest values are measured. The close is the default; a median or typical price gives a smoother range.
- Length
- How many bars the range covers. A longer window gives a steadier line that steps less often and starts later.
Frequently asked questions
How is this different from Midpoint Price over Period?
Midpoint uses one source series, so its range runs from the lowest close to the highest close by default. Midpoint Price over Period uses the highest high and the lowest low, so its range includes the wicks.
Why does the line move in steps?
It changes only when the highest or lowest value in the window changes. Between those moments it stays flat, unlike a moving average that shifts on every bar.
When does the first value appear?
On bar length - 1, the first bar where the window holds a full length bars.