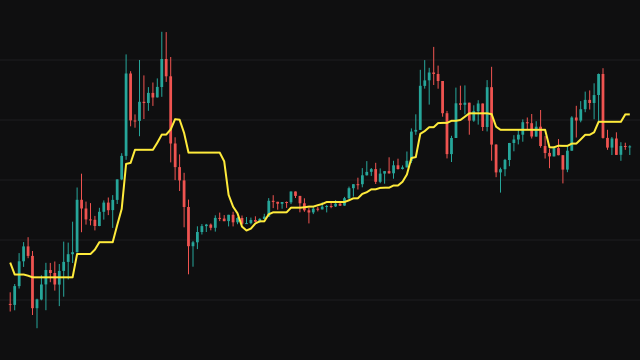
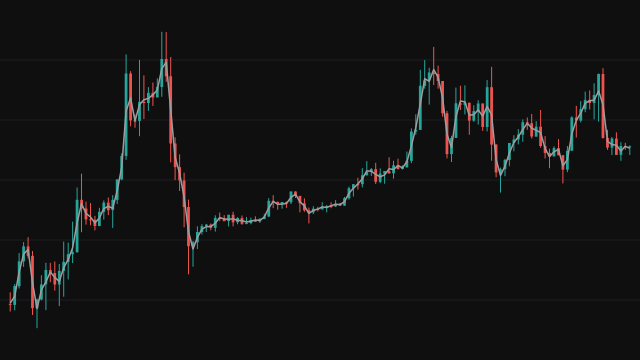
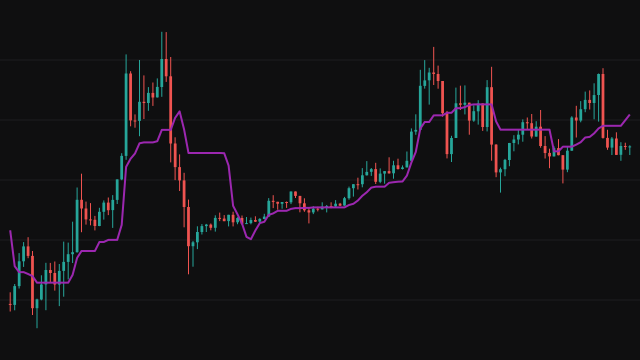
Median Price is the middle of each bar's range: its high plus its low, divided by two. It ignores where the bar opened and closed and looks only at the two extremes it reached.
The study draws that midpoint as a line over the price chart. It has no lookback window and no smoothing, so it starts on the first bar and each point depends only on its own bar. The name refers to the middle of the range, not to a statistical median taken over many bars.
How to read MEDPRICE: Median Price
Compare the close with the median price to see which half of its range a bar finished in. A close above the line means buyers held the bar in its upper half; a close below means it settled in the lower half.
The line follows each bar's range closely and is not a trend filter on its own. It is often used as the input to other studies, such as moving averages or oscillators, that want a value less sensitive to the closing print.
Frequently asked questions
Is this a median over several bars?
No. It is the midpoint of a single bar, (high + low) / 2. Each bar has its own value and there is no window.
Why use it instead of the close?
It depends only on how far the bar travelled in each direction, so a late spike into the close does not move it unless that spike also set a new high or low.
Does it need any warmup?
No. It answers from the first bar, because it never looks back at earlier bars.