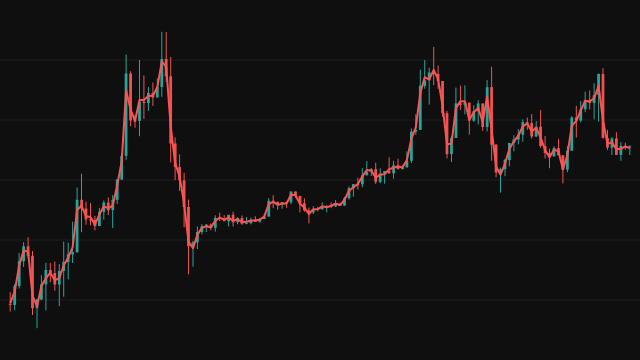
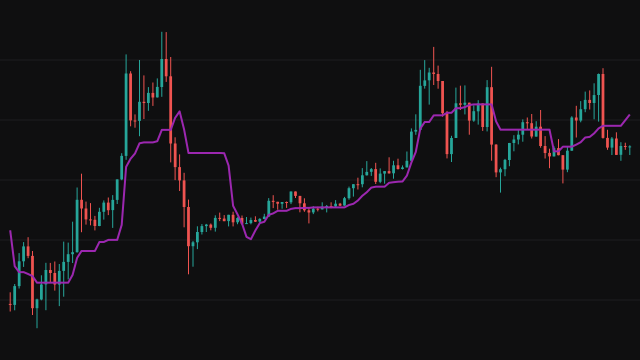
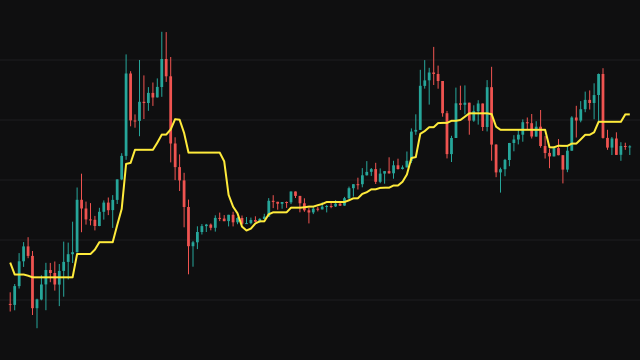
Typical Price is the average of three prices from each bar: the high, the low and the close, added together and divided by three. It leaves out the open and gives the close one third of the weight, so the value reflects both the range the bar covered and where it finished.
The study draws that value as a line over the price chart. There is no lookback window and no smoothing, so the line starts on the first bar and every point depends only on its own bar. It is the usual input for band and volume studies that want a price richer than the close.
How to read TYPPRICE: Typical Price
Read the line as one representative price for each bar. A close above it means the bar ended near the top of its range; a close below it means the bar ended in its lower part.
On its own the line moves bar by bar and does not filter noise. Its main use is as a source for other studies: averages, deviation bands and money flow calculations built on the typical price react to the whole bar instead of only the last print.
Frequently asked questions
Why are only three prices used?
The formula uses only the high, the low and the close: the high and the low describe the range, and the close describes where the bar settled.
How is it different from Average Price?
Average Price adds the open and divides by four. Typical Price leaves the open out and divides by three, so the close weighs a little more.
Does it need any warmup?
No. Each value uses only its own bar, so the line starts on the first bar of the chart.