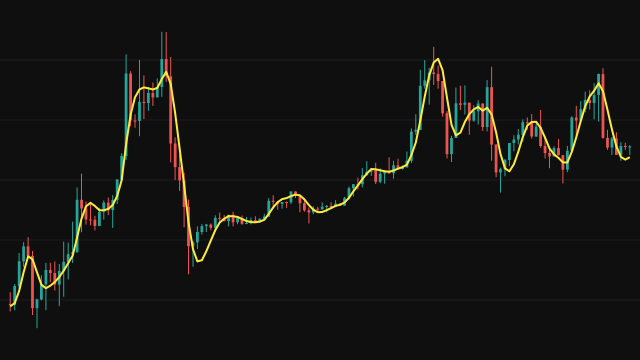
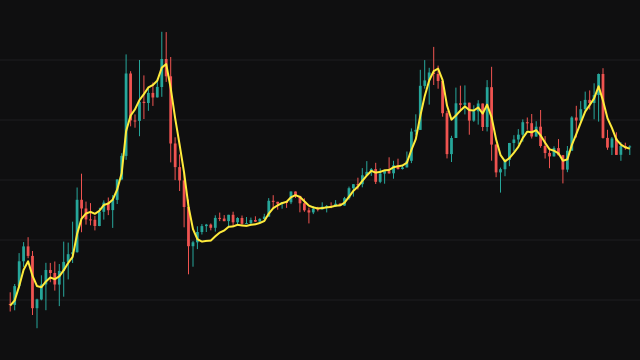
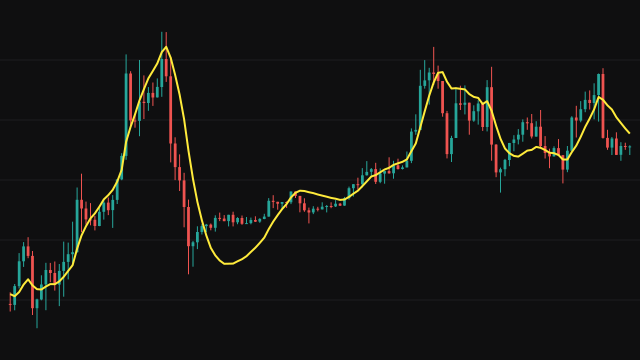
The Henderson Moving Average is a symmetric weighted average from the field of seasonal adjustment. Its weights come from a closed formula that depends only on the window length. They are largest at the centre of the window, fall away toward the edges and turn slightly negative at the outermost bars. That shape lets a smooth trend, up to a cubic curve, pass through the filter unchanged while short swings are suppressed.
The window must be odd and at least five bars long; an even period is raised to the next odd number. The weights are computed once, scaled to sum to one and applied to the last period prices. Until the window is full the line sits on the price itself, and a missing price counts as zero.
How to read Henderson Moving Average (HEND)
Read the HEND as a trend line that keeps the shape of curving moves better than a simple or weighted average. Because the weights are symmetric, the value on any bar describes the middle of its window, so the line runs about half a window behind price. The negative edge weights make it hug turning points more tightly than a plain average of the same length.
Use it to see the direction and curvature of the trend. It is not a fast signal line, and the first bars, where it equals price, carry no smoothing.
Settings
- Source
- The price series the average is taken from, the close by default.
- Period
- Length of the window, odd and at least 5. An even value is raised to the next odd one. Longer windows smooth more and lag more.
Frequently asked questions
Why must the period be odd?
The Henderson weights are symmetric around a central bar, which needs the same number of bars on each side. An even setting is raised by one.
Why are some weights negative?
The formula is built to pass a cubic trend through unchanged. Small negative weights at the edges are what let it follow a curving trend instead of flattening it.
Why does the line equal price at the start of the chart?
Until the window holds the full period, there are not enough bars to apply the weights, so the line simply returns the price.