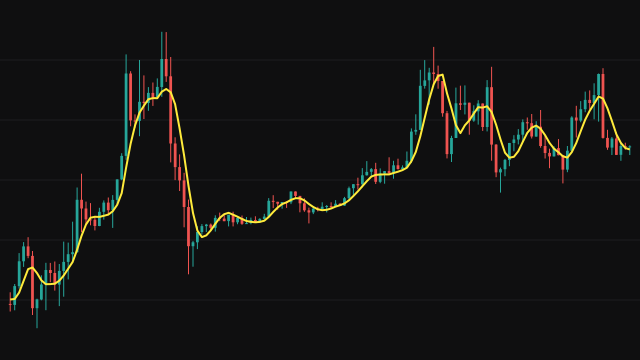
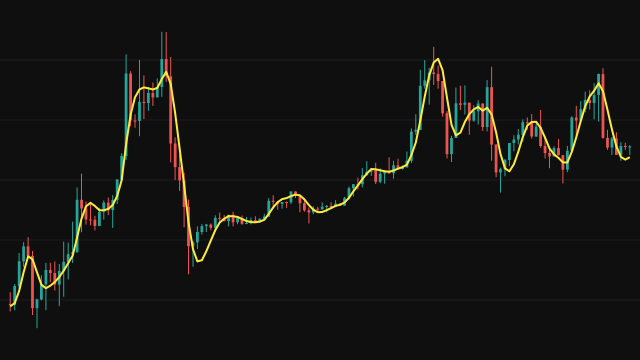
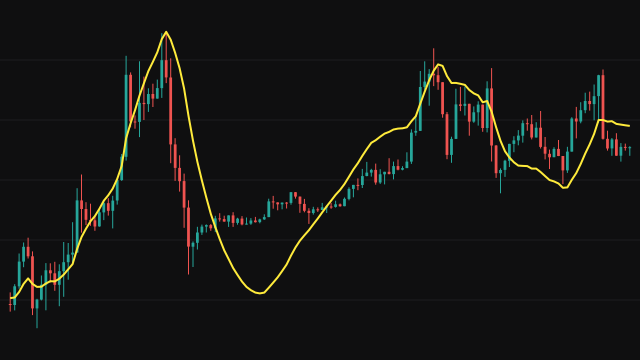
HOLT keeps two numbers from bar to bar: a level and a trend. Each bar the level is pulled toward the source by the weight alpha = 2 / (period + 1), starting from where the previous level plus the previous trend said it would be. The trend is then updated from the change in the level, smoothed by its own weight gamma.
The plotted line is the level plus the trend, a one-bar-ahead forecast. Because the trend term carries the line forward in the direction of the move, it keeps up with a steady trend that a plain exponential average would trail.
The first bar sets the level to the source with a zero trend and shows the source unchanged. When Gamma is left at 0, the trend uses the same weight as the level.
How to read Holt Exponential Moving Average (HOLT)
Use HOLT as a fast trend line. While price trends steadily, the line sits close to price rather than trailing behind it, and its slope is a direct read of the current trend. A flattening line says the trend term is fading.
The forecast keeps going in the direction it has been moving, so at a sharp reversal the line overshoots for a few bars before turning. A larger Gamma makes the trend react faster and overshoot more; a smaller one gives a steadier but slower trend.
Settings
- Period
- Sets the level weight
2 / (period + 1). A longer period gives a smoother line that reacts more slowly. - Gamma (0 = auto)
- Smoothing weight for the trend term. At 0 it uses the same weight as the level; higher values let the trend change faster.
- Source
- The price series the average follows. Close is the usual choice; hl2 or another blend smooths out closes that jump around.
Frequently asked questions
Why does the line sometimes run ahead of price?
It plots the level plus the trend, which is a forecast of the next bar. After a strong move the trend term keeps pushing the line on for a few bars before it catches the reversal.
What does Gamma 0 mean?
It is the automatic setting: the trend is smoothed with the same weight as the level, 2 / (period + 1).
How is this different from a double exponential average?
A double exponential average subtracts the lag of a second smoothing. HOLT instead tracks an explicit trend and adds it to the level, which behaves similarly in a steady trend but responds differently at turns.