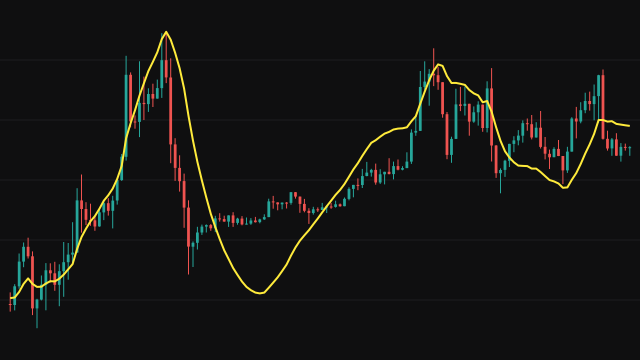
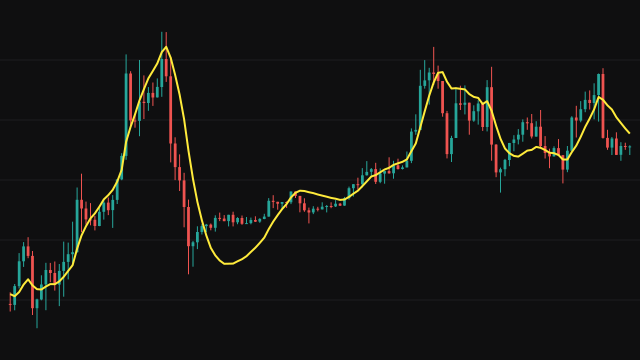
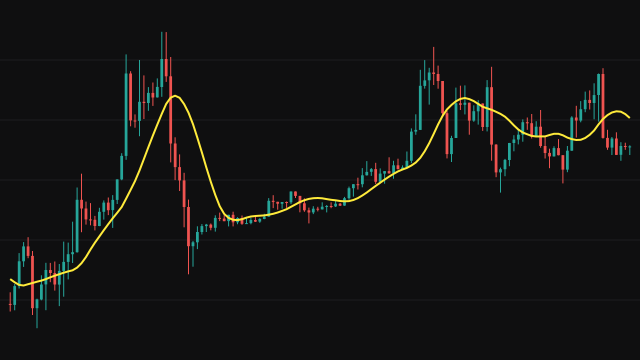
HTIT starts by smoothing the source twice with a four-bar weighted average. It then runs the smoothed price through a Hilbert transform, a set of four-tap filters that split it into an in-phase component and a quadrature component, ninety degrees apart. Comparing those components bar to bar gives an estimate of the dominant cycle period, smoothed and held between 6 and 50 bars, which scales the gain of every filter stage.
The phase of the in-phase and quadrature pair and their combined strength add a small cyclic correction to the smoothed price. The trendline then mixes that corrected value with its own previous value, so it follows the trend while the cycle swings around it.
The first bars are empty while the filters fill: the transform needs several bars of smoothed history before it answers.
How to read Hilbert Trendline (HTIT)
Use HTIT as the trend underneath the cycles. When price oscillates around a flat or gently sloping HTIT, the market is cycling; when price moves away and the line follows with a steady slope, it is trending. Crosses of price and the line mark shifts between the two.
Each bar the line is 0.9 of the corrected smoothed price plus 0.1 of its own previous value, so it stays close to the double smoothed price and turns with it rather than behaving like a long, slow average. The cycle estimate needs a stretch of bars to settle, so the earliest part of the line is less reliable.
Settings
- Source
- The price series the average follows. Close is the usual choice; hl2 or another blend smooths out closes that jump around.
Frequently asked questions
Why is the start of the chart empty?
The double smoothing and the Hilbert filters read several bars of history. Until those exist the values are absent and nothing is drawn.
Does it have a length setting?
No. The smoothing is fixed: two four-bar weighted averages, then a blend of 0.9 of the new value with 0.1 of the previous trendline. The measured cycle period, kept between 6 and 50 bars, only scales the gain of the Hilbert filters that size the cyclic correction.
What does the cycle correction do?
It adds a small amount, scaled by the cycle's strength and the sine of its phase, to the smoothed price before the trendline is updated, so the line accounts for where price is within the cycle.